Revenue Forecasting
WorkBook's Revenue Forecast feature combines actuals from Finance & Administration with forecast data from the Price submodule (in the Jobs module) and Pipelines submodule (in the CRM module), and then provides an Excel-like environment where you can change forecast values on the fly for a given fiscal year. You can run revenue forecasts based on gross revenues or net revenues. You create the forecast methods in .
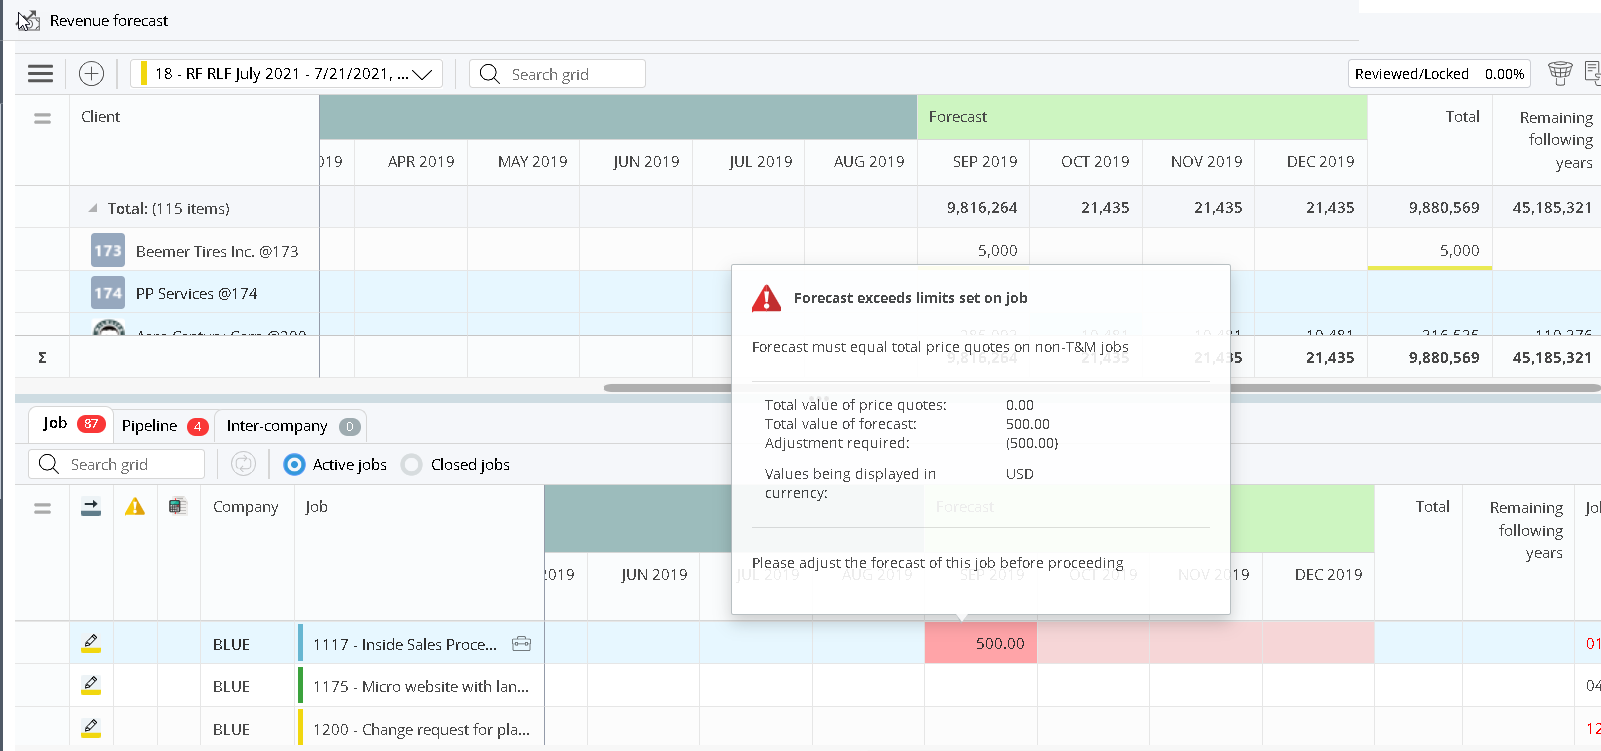
Revenue Forecast provides two grids. The top grid displays the selected Company's clients, along with the Price Quote net revenue, remaining amount, previous revenue, revenue YTD, monthly actuals, and total forecast for each client. You cannot change the values in the top grid. The bottom grid provides three tabs: Job, Pipeline, and Inter-Company. Use these tabs to enter the net revenue forecast values.
Use the bottom grid to change the values in the month columns in the Forecast section for the selected revenue forecast. WorkBook automatically updates the top grid to reflect the changes to the forecast values that you enter in the bottom grid. When you enter a value in any of the month columns in the Forecast section of the bottom grid in Net Revenue Forecast, WorkBook displays a tooltip that shows the variance between the Price Quote amount and your forecast. Depending on the Price Quote method that you select in Settings, the revenue forecast and Price Quote amount might need to balance for the duration of the forecast. WorkBook checks this automatically.
To use Revenue Forecast, you must have access to Finance & Administration as defined in User Access Rights under Settings.