Tripwire Thresholds
A tripwire threshold is a defined value that, if exceeded, causes a metric to be classified as "triggered."
A metric can have multiple trigger points with corresponding color coding for each interval. The threshold editor enables customizable bandwidths or thresholds to be defined, color coded, and described.
Each metric includes an optional set of tripwire thresholds. You use these thresholds to graphically show when a defined threshold is exceeded. They enable the grouping and aggregating of multiple activities together so that results for a ribbon or phase or intersection can be calculated. Tripwire thresholds can be based on either the primary or secondary formula.
The threshold can be shown as discrete (that is, traffic lights), gradient, or mixed (combination of discrete and gradient). Thresholds cannot be set for a range of values but must be defined for the boundary that defines a range.
Tripwire Threshold Scales
If you enable the secondary formula by selecting the check box for the secondary metric, then the tripwire threshold is automatically associated with the secondary metric. If you do not select the check box, the tripwire threshold is automatically associated with the primary formula.
Tripwire threshold scales can be defined as having any number of intervals. To help with the creation of such scales, use the menu to automatically create standard scales.
Normal and Gradient Scales
You can define threshold intervals as either normal or gradient. By default, scales are defined as normal. All threshold intervals within a single metric are either normal or gradient-based (they cannot be mixed within a metric).
Normal scales behave in an absolute or binary manner - that is, a metric result either does or does not trigger a threshold.
A gradient scale behaves differently in that a metric result, while falling within a given interval, can be represented as being close to an interval boundary. This type of scale is useful when determining how close a metric result is to a tripwire boundary. When using gradient scales, instead of discrete colors for the intervals being used, gradient scales of color are used (based on where the metric falls in the scale).
Threshold Limits
After the tripwire scales have been defined, the threshold limits must be set. Typically a different color is setup for each different limit. Since Acumen defines ranges vs. limits - small ranges must be created around a limit. Identify the threshold or level for each color, then identify a small limit around that threshold to create the tripwire threshold.
For example, to detect how many activities are at zero and at 0.5, levels are defined around zero and 0.5 as follows:
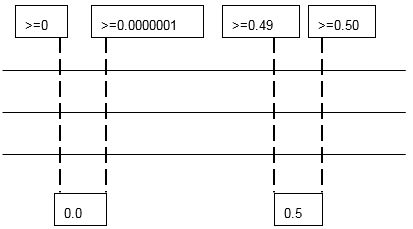
After these ranges are defined, enter them into the table to create the tripwires. If color is associated with each one of the levels, then the colors will appear on the Ribbon View after analysis.