Risk Exposure Comparison
Use the Risk Exposure Comparison chart to compare multiple risk exposure scenarios.
In order to perform a comparison, you need to use the Risk Exposure chart to add distribution curves to the risk comparison.
Curves Tab
Use the columns in this tab to hide a step in the graph, change color, edit a name, or remove step data.
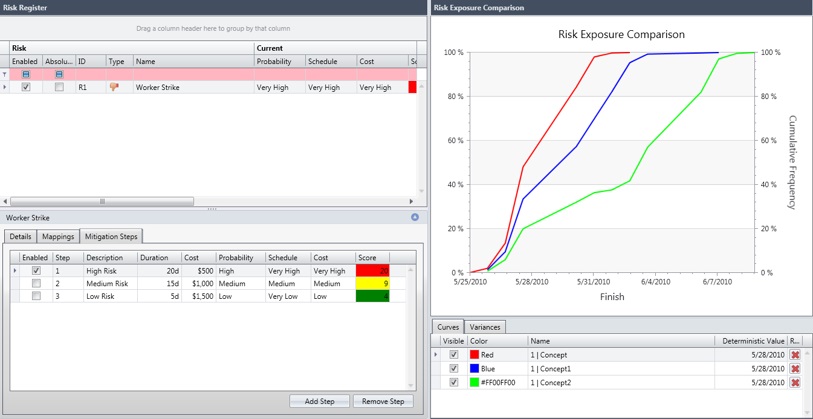
Example of a Risk Exposure Comparison Chart
In the example below, risk analysis with mitigation has been performed three times, once with all three mitigation steps, once with the first two, and once with only the first step selected. The Risk Exposure Comparison chart displays the results of the three scenarios.