Comparing Risk Mitigation Steps
After you have created risk mitigation steps, use the Risk Register Mitigation Analysis to run risk analysis with mitigation for the selected risk event to compare mitigation steps.
Acumen runs the analysis on each mitigation step one-at-a-time then displays a Mitigation Steps chart that shows you how the mitigation affects the schedule.
For example, if the selected risk has four mitigation steps, Acumen runs the analysis with no mitigation, then runs the analysis using mitigation step 1, then steps 1 and 2, then steps 1 through 3, then steps 1 through 4.
When the analysis runs, it uses the Run Risk Analysis options that you have set except for Scenarios where it always uses the Uncertainty and Risk Events (Mitigated, Including Overhead) option.
The chart displays one bar for each mitigation step and one for no mitigation. The bar colors are the risk score colors as defined by the risk scoring matrix. The chart header is the risk event ID plus name. The sub-header displays the first activity in the schedule being affected by the risk event as well as its start date. You need to have the mitigation complete before that date if it is going to help.
Example of a Mitigation Analysis Chart
In this example, the chart is showing you that if you go with mitigation steps 1 through 4, you will need 300 days of mitigation and $1,069,000.00 to save 111 days.
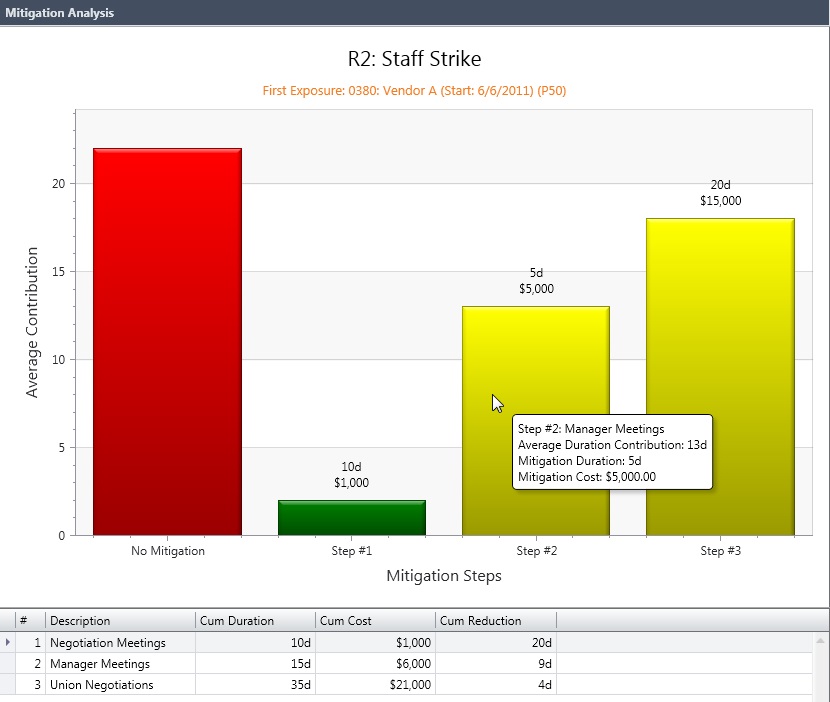
- The # column displays the mitigation step number.
- The Description column displays the mitigation step description or name.
- The Cumulative Duration column displays the cumulative mitigation duration.
- The Cumulative Cost column displays the cumulative mitigation cost.
- The Cumulative Reduction column displays the change in days from no mitigation, to mitigation step 1, to mitigation step 2, and so on.