Metric Values by Selected Dimension Chart
The bar chart at the bottom of the Projects tab displays metric values by dimension value. You select the metric and dimension you want to analyze. Position the mouse pointer over a bar to display the actual metric value.
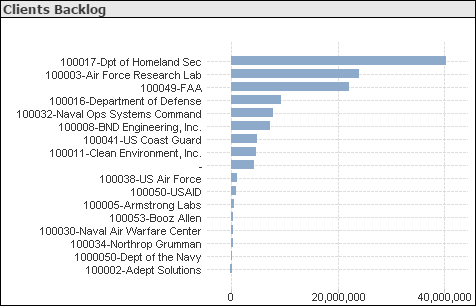
Example: Backlog Contribution by Client
To display the amount of your current backlog contributed by each client, click Client in the Select a Dimension list and Backlog in the Select a Metric list.
Period and YTD Options
If you select
Revenue,
Cost, or
Profit in the
Select a Metric list, the metric values displayed depend on whether you select the
Period or
YTD option:
- If you select the Period option, the metric values are the values for the latest period in the current fiscal year.
- If you select the YTD option, the metric values are the year-to-date values as of the end of the latest period in the current fiscal year.
If you select Backlog, AR, or Unbilled in the Select a Metric list, the metric values are always the inception-to-date balances as of the end of the latest period in the current fiscal year.
Filters Options
Use the filter lists on the left side of the dashboard to focus the chart on...
- Data for a specific company (if your firm has multiple companies in Costpoint)
- Data for one or more specific organization codes. Use the
 icon at the top of the
Org filter list to display organization codes for all levels of the organization structure or only the organization codes for a specific level.
icon at the top of the
Org filter list to display organization codes for all levels of the organization structure or only the organization codes for a specific level.