High/Low Analysis Table
The High/Low Analysis table at the bottom of the Projects tab enables you to quickly review information for your best or worst "performers." You select the type of performer (a dimension), the metric by which performance is measured, and the number of dimension values you want to display in the table.
Example: Top 10 Clients for Contribution to Backlog
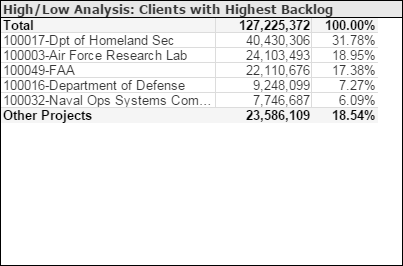
To display data for the ten clients that are the top contributors to your backlog, select Top in Select Top or Bottom. If the number next to Select Top or Bottom is not 10, click the number and enter 10. In the Select a Dimension list, click Client, and in the Select a Metric list, click Backlog.
The table lists the ten clients that are the top ten contributors to backlog, along with the associated backlog amount and percentage of total backlog for each. It also displays the total backlog amount and the amount and percentage contributed by all clients not specifically listed.
Period and YTD Options
- If you select the Period option, the dimensions are evaluated based on the metric values for the latest period in the current fiscal year.
- If you select the YTD option, the dimensions are evaluated based on the year-to-date metric values as of the end of the latest period in the current fiscal year.
If you select Backlog, AR, or Unbilled in the Select a Metric list, the metric values evaluated are always the inception-to-date balances as of the end of the latest period in the current fiscal year.
Filters Options
- A specific company (if your firm has multiple companies in Costpoint)
- One or more specific organization codes. Use the
 icon at the top of the
Org filter list to display organization codes for all levels of the organization structure or only the organization codes for a specific level.
icon at the top of the
Org filter list to display organization codes for all levels of the organization structure or only the organization codes for a specific level.