Pool Cost and Pool Base Chart
The Pool Cost and Pool Base chart enables you to visually compare pool cost and base amounts for selected cost pools in a horizontal bar chart.
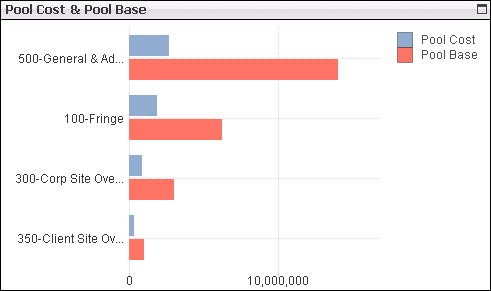
To see the exact amount that a bar represents, position the mouse pointer over that bar.
Period and Year-to-Date Amounts
Select the YTD option to display the year-to-date cost and base amounts. Select the Period option to display amounts only for the current fiscal period.
Filter Options
Use the filter lists on the left side of the dashboard to...
- Select the company for which you want to analyze indirect rates
- Focus the chart on one or more types of cost pools