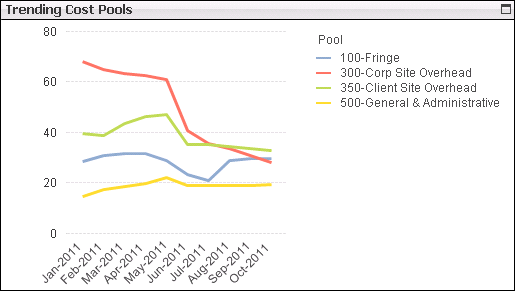
Trending Cost Pools Chart
The Trending Cost Pools line chart compares how the actual indirect rates for the cost pools you select have trended over time.

Hover over any of the data points to display a tooltip containing the actual rate for that cost pool and period.
Period and Year-to-Date Rates
If you select the
YTD option, the rate for each data point is calculated as follows:
- YTD cost pool actual cost through that period / YTD base pool actual amount through that period.
If you select the
Period option, the rate for each data point is calculated as follows:
- Actual cost pool cost for that period / Actual base pool amount for that period.
Filter Options
Use the filter lists on the left side of the dashboard to...
- Select the company for which you want to analyze indirect rates
- Focus the chart on one or more types of cost pools
