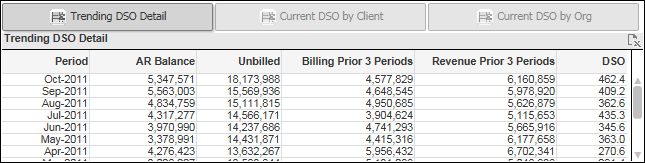
Trending DSO Detail Table
The Trending DSO Detail table displays, by period, ending AR balance, ending unbilled balance, total billing amount for the prior three periods, total revenue for the prior three periods, and the DSO value.
DSO Calculation
How CFO Dashboards calculates DSO values depends on the options you select in the AR/DSO chart below this table:
- If you select Yes in Include Unbilled, unbilled amounts are included in the DSO calculation.
- If you select Revenue in Divided by, revenue amounts are used, and if you select Billing in that field, billing amounts are used.
Depending on those decisions, your DSO formula will be one of the following:
- AR / (Billing for prior 3 periods / 90 days)
- AR / (Revenue for prior 3 periods / 90 days)
- (AR + Unbilled) / (Billing for prior 3 periods / 90 days)
- (AR + Unbilled) / (Revenue for prior 3 periods / 90 days)
If you include unbilled in DSO, CFO Dashboards calculates unbilled using inception-to-date (ITD) revenue and billing: Unbilled = ITD revenue – ITD billing
Filter Options
Use the filter lists on the left side of the dashboard to display...
- DSO data for a specific company (if your firm has multiple companies in Costpoint)
- DSO data associated with one or more specific organization codes. Use the
 icon at the top of the
Org filter list to display organization codes for all levels of the organization structure or only the organization codes for a specific level.
icon at the top of the
Org filter list to display organization codes for all levels of the organization structure or only the organization codes for a specific level.
Export to Excel
To export the data in this table to a Microsoft® Excel® spreadsheet, click
 in the upper-right corner of the table.