Backlog Chart
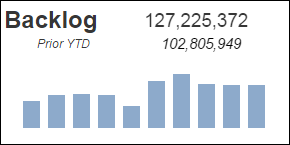
The Backlog bar chart on the Projects tab displays project backlog as of the end of each period in the current fiscal year. Position the mouse pointer over a bar to display the actual backlog amount in a tooltip.
Backlog Calculation
Backlog for a project is calculated as follows: Initial contract value + Contract value changes - Inception-to-date revenue.
Period and YTD Options
The Period and YTD options do not affect the bar chart. It always displays inception-to-date balances. However, these options do affect whether the prior amount displayed above the chart is the backlog as of the end of the prior period or as of the end of the same period in the previous year.
Current and Prior Amounts
The backlog amount as of the end of the latest period in the current fiscal year displays above the chart. The prior backlog amount displayed below the current amount is one of the following:
- If you select the Period option, the prior amount is the backlog as of the end of the previous period in the current fiscal year.
- If you select the YTD option, the prior amount is the backlog as of the end of the current period in the prior fiscal year.
Filters Options
Use the filter lists on the left side of the dashboard to focus the chart on...
- Backlog for a specific company (if your firm has multiple companies in Costpoint)
- Backlog associated with one or more specific organization codes. Use the
 icon at the top of the
Org filter list to display organization codes for all levels of the organization structure or only the organization codes for a specific level.
icon at the top of the
Org filter list to display organization codes for all levels of the organization structure or only the organization codes for a specific level.