Trended Profit / Loss Chart
The Trended Profit / Loss line chart shows how profit in the general ledger has changed over time for the current fiscal year. You can view trending for period-by-period profit or for year-to-date profit.
If budget data is loaded into the data model, this chart includes a budget line to give you a quick picture of performance against expected profit based on the budget. Use the Display Budgets and Variances option in the lower-left corner of the dashboard to display or hide the budget line.
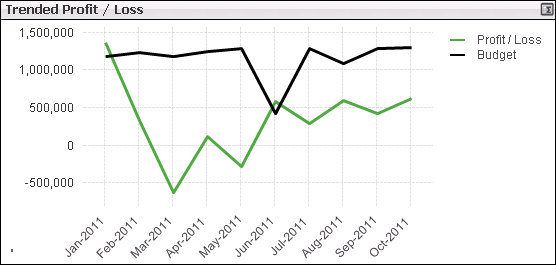
Hover over any of the data points to display a tooltip containing the corresponding profit or budget amount for that data point. You can also use the Fast Change icon ( ) in the upper-right corner of the chart to switch to a straight table that displays all of the profit and budget amounts on which the chart is based.
Income Statement Formats
By default, the chart represents data from the income statement format designated as the primary format in Costpoint. However, all available income statement formats display in the Income Statements list so you can select a different format for analysis.
If your firm has multiple companies in Costpoint, the Income Statements list contains all income statement formats for all companies. By default, CFO Dashboards selects the primary income statement format for one of the companies, but you can select a different format if the default format is not for the company you are interested in.
Note: If you click Clear on the toolbar, the financial statement name is cleared along with other filter selections, and you must then make a selection in Income Statements to display any data.
Profit Calculation
If you select Period in Select Period or Cumulative YTD, the profit amount for each chart data point is the net amount for that period for all account balances included in the selected income statement format. The amount for each budget data point is the net budget amount for that period for all accounts included in the income statement format.
If you select YTD in Select Period or Cumulative YTD, the profit amount for each chart data point is the YTD net amount as of that period for all account balances included in the selected income statement format. The amount for each budget data point is the YTD net budget amount as of that period for all accounts included in the income statement format.
Filter Options
- Profit based on accounts for a specific company (if your firm has multiple companies in Costpoint)
- Profit based on accounts associated with one or more specific organization codes. Use the
 icon at the top of the
Org filter list to display organization codes for all levels of the organization structure or only the organization codes for a specific level.
icon at the top of the
Org filter list to display organization codes for all levels of the organization structure or only the organization codes for a specific level.
- Profit based on account balances associated with one or more specific account codes. Use the
icon at the top of the
Account filter list to display the account codes for a specific level.