Current Pipeline Chart
The Current Pipeline chart displays a breakdown of total pipeline by stage as of today's date. Each colored layer in the funnel chart represents the contribution of the corresponding stage to the total pipeline. The total current pipeline amount displays below the chart.
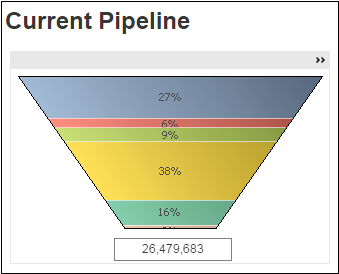
To see the pipeline data for a specific stage, position the mouse pointer over that segment. When you do, CFO Dashboards displays the stage name, pipeline amount, and percentage of total pipeline.
The default chart is a funnel chart, but you can click the Fast Change icon ( ) in the chart title bar to switch to a table that displays the dollar amounts and percentage of total pipeline for each stage.
Pipeline Amounts
- The unweighted pipeline amount for a stage is the sum of the estimated revenue amounts for the opportunities currently assigned to the stage.
- The weighted pipeline amount for a stage is the sum of the weighted estimated revenue amounts for the opportunities currently assigned to the stage: Weighted estimated revenue = Estimated revenue X Probability
Use the Pipeline Probability Weighting options on the dashboard to switch between weighted and unweighted pipeline amounts.
Opportunities Included in Current Pipeline?
Which opportunities are included in your current pipeline is based on the stage each opportunity is currently assigned to. Your system administrator specifies which stages are included in current pipeline, either when configuring Capture Analytics or, if your firm does not use Capture Analytics, when extracting data from an alternative data source. Opportunities assigned to a current pipeline stage are automatically included in the calculation of current pipeline amounts, and opportunities that are not assigned to one of those stages are not included.
For example, if your firm has a Won stage but does not want to include won contracts in current pipeline amounts, the system administrator does not include that stage, and the opportunities assigned to that stage are excluded from current pipeline amounts.
Filter Options
- Opportunities with a win probability greater than a specified percentage.
- Opportunities that are associated with a specific company (if your firm has multiple companies in Costpoint).
- Opportunities that are associated with one or more specific organization codes. Use the
 icon at the top of the
Org filter list to display organization codes for all levels of the organization structure or only the organization codes for a specific level. (If
~No Value~ displays in the
Org list, it indicates that one or more opportunities are not assigned to an organization. You can select
~No Value~ to focus the chart on those opportunities.)
icon at the top of the
Org filter list to display organization codes for all levels of the organization structure or only the organization codes for a specific level. (If
~No Value~ displays in the
Org list, it indicates that one or more opportunities are not assigned to an organization. You can select
~No Value~ to focus the chart on those opportunities.)
- Opportunities that are associated with selected clients.
- Specific types of opportunities.