Projects Summary
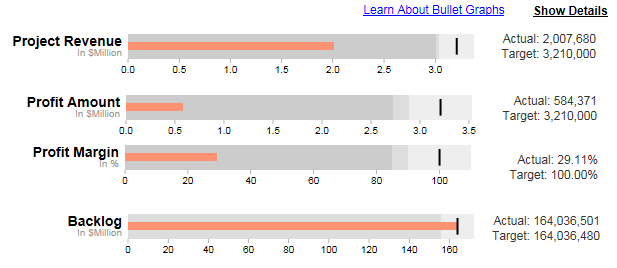
The Projects Summary displays four key project-based metrics: project revenue, profit, profit margin, and backlog.
Use the Period and YTD options at the top of the dashboard to switch between current period values and year-to-date values.
Click Show Details to go to the Projects dashboard to view and analyze project data at a more detailed level.
As Of Date
The Projects Summary analytics reflect the revenue amount, profit amount, and profit margin percentage either for the current fiscal period or for the current fiscal year to date, depending on whether you select Period oe YTD at the top of the dashboard. The Backlog graph always represents the inception-to-date balance.
Reading the Graphs
The red horizontal bars on the Project Revenue, Profit Amount, Profit Margin, and Backlog bullet graphs represent the actual amount or percentage for each metric. The black vertical bar on each graph represents the target budget amounts or percentage. The actual and target values display to the right of each of the bullet graphs.
The background areas of the graphs are divided into shaded alert areas based on tolerance settings for budget variance percentage that your system administrator establishes:
- Acceptable: If the bar extends into the lightest gray area on the right, performance is acceptable.
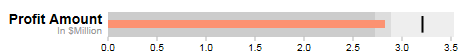
- Cautionary alert: If the bar only extends into the medium gray area (as in the illustration above), performance is below the expected level but is not yet a critical problem.
- Urgent alert: If the bar does not extend beyond the dark gray area, performance is far enough below budget that it requires urgent attention.
Revenue Calculation
The revenue amount is the sum of revenue for revenue-level projects.
Profit Calculation
The profit amount is the sum of profit for revenue-level projects. Project profit is calculated as follows: Project revenue - All project direct and indirect costs.
Profit Margin Calculation
The profit margin percentage is calculated as follows: Project profit / Project revenue.
Backlog Calculation
The backlog amount is the sum of project backlog amounts. Backlog for a project is calculated as follows: Initial contract value + Contract value changes - Inception-to-date revenue.
Filters Options
- Project KPIs for a specific company (if your firm has multiple companies in Costpoint)
- Project KPIs associated with one or more specific organization codes. Use the
 icon at the top of the
Org filter list to display organization codes for all levels of the organization structure or only the organization codes for a specific level.
icon at the top of the
Org filter list to display organization codes for all levels of the organization structure or only the organization codes for a specific level.