Income Statement Table
For the Costpoint income statement format you select in Income Statements, the Income Statement table displays revenue and expense balances for the current period, quarter-to-date, and year-to-date.
If budget data is loaded into the data model, it also offers period, QTD, and YTD budget amounts and variances (actual amount - budget amount), enabling you to spot large budget variances and drill to the detail accounts to pinpoint the sources of the problem. Use the Display Budgets and Variances option in the lower-left corner of the dashboard to display or hide the budget and variance columns.
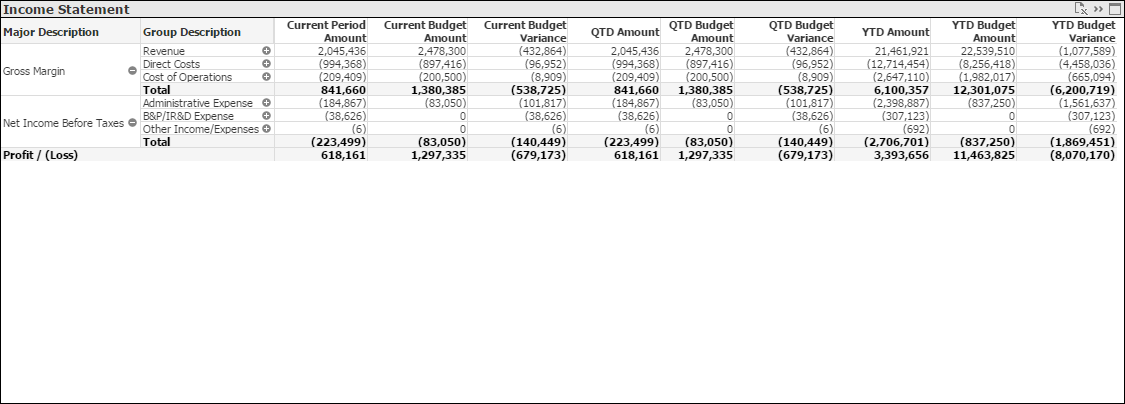
By default, the table is a pivot table. That format enables you to expand the rows to display data down to the lowest account level or to collapse rows to summarize by higher account level, financial statement line description, financial statement group description, or financial statement major description.
Use the Fast Change icon ( ) in the upper-right corner of the table to switch to the straight table format. In the straight table format, each row displays balances for a single account level code. Right-click
 in the
Account Level column heading to select the account level you want to display balances for.
in the
Account Level column heading to select the account level you want to display balances for.
Income Statement Formats
By default, the table displays data from the income statement format designated as the primary format in Costpoint. However, all available income statement formats display in the Income Statements list so you can select a different format for analysis.
If your firm has multiple companies in Costpoint, the Income Statements list contains all income statement formats for all companies. By default, CFO Dashboards selects the primary income statement format for one of the companies, but you can select a different format if the default format is not for the company you are interested in.
Note: If you click Clear on the toolbar, the financial statement name is cleared along with other filter selections, and you must then make a selection in Income Statements to display any data.
Filter Options
- Profit based on accounts for a specific company (if your firm has multiple companies in Costpoint)
- Profit based on accounts associated with one or more specific organization codes. Use the
 icon at the top of the
Org filter list to display organization codes for all levels of the organization structure or only the organization codes for a specific level.
icon at the top of the
Org filter list to display organization codes for all levels of the organization structure or only the organization codes for a specific level.
- Profit based on account balances associated with one or more specific account codes. Use the
icon at the top of the
Account filter list to display the account codes for a specific level.
Export to Excel
To export the data in this table to a Microsoft® Excel® spreadsheet, click
 in the upper-right corner of the table.