AR/DSO Chart
The AR/DSO chart displays, by period, either AR amounts or DSO values, depending on the option you select in Show AR By.
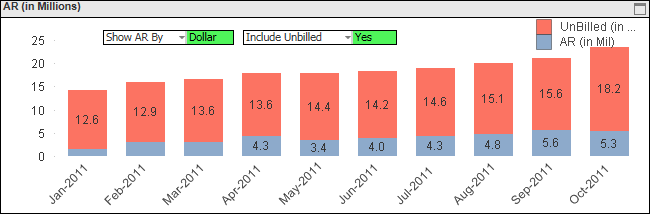
Select Dollar in Show AR By to display the AR chart. If you also select Yes in Include Unbilled, the chart displays stacked bars with a segment for AR and a segment for unbilled. If you select No in Include Unbilled, the chart displays only AR:
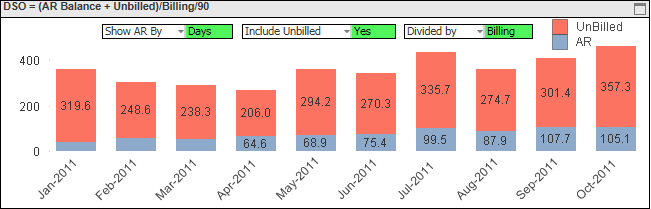
Select Days in Show AR By to display the DSO chart. If you also select Yes in Include Unbilled, the chart displays stacked bars with a segment for DSO based on AR and a segment for DSO based on unbilled. If you select No in Include Unbilled, the chart displays only DSO based on AR:
DSO Calculation
- If you select Yes in Include Unbilled, unbilled amounts are included in the DSO calculation.
- If you select Revenue in Divided by, revenue amounts are used, and if you select Billing in that field, billing amounts are used.
- AR / (Billing for prior 3 periods / 90 days)
- AR / (Revenue for prior 3 periods / 90 days)
- (AR + Unbilled) / (Billing for prior 3 periods / 90 days)
- (AR + Unbilled) / (Revenue for prior 3 periods / 90 days)
If you include unbilled in DSO, CFO Dashboards calculates unbilled using inception-to-date (ITD) revenue and billing: Unbilled = ITD revenue – ITD billing
Filter Options
- DSO data for a specific company (if your firm has multiple companies in Costpoint)
- DSO data associated with one or more specific organization codes. Use the
 icon at the top of the
Org filter list to display organization codes for all levels of the organization structure or only the organization codes for a specific level.
icon at the top of the
Org filter list to display organization codes for all levels of the organization structure or only the organization codes for a specific level.