Revenue Per Employee by Org Table
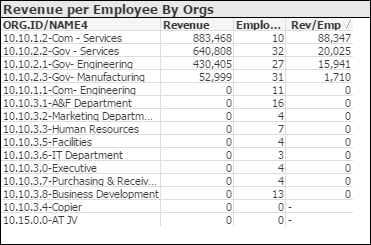
The Revenue Per Employee by Org table displays project revenue, employee count, and revenue per employee by performing organization.
Display Options
- Select Period or Cumulative YTD: Indicate if you want to display data for the current fiscal period or for the fiscal year to date. Your system administrator uses a Costpoint Analytics configuration setting to specify which fiscal period is the current period for project data.
- Select a Dimension: Select the level of the organization structure for which you want to display data.
Employee Count and Revenue Per Employee
Elsewhere on the Employee Count and Utilization dashboard, the employee counts are the number of current active employees. Where employee count is shown by organization, it is based on the employees' home organizations. In this table, however, the employee counts are the number of employees for whom labor records exist, and the organizations are the performing organizations associated with the project revenue amounts. For example, if you select YTD in Select Period or Cumulative YTD, the employee count for an organization includes all employees for whom labor records exist for that organization for the current fiscal year. That count could include not only current active employees but also employees who became inactive or terminated during the year.
Revenue per employee is calculated as follows: Project revenue associated with the performing organization / Employee count for that organization.
Filters Options
- Revenue per employee for a specific company (if your firm has multiple companies in Costpoint)
- Revenue per employee for one or more specific organization codes. Use the
 icon at the top of the
Org filter list to display organization codes for all levels of the organization structure or only the organization codes for a specific level.
icon at the top of the
Org filter list to display organization codes for all levels of the organization structure or only the organization codes for a specific level.