Business Development Summary
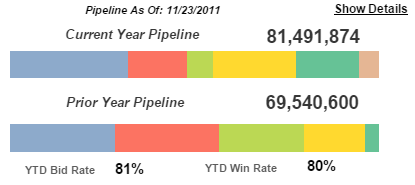
The Business Development Summary charts displays a breakdown of total pipeline by stage for the current year, as of today's date, and for the prior year, as of the same date in that year. Each colored segment in the bars represents the contribution of the corresponding stage to the total pipeline. The prior year pipeline amount and current pipeline amount display above their respective charts.
In addition, the year-to-date bid rate and win rate display below the pipeline charts.
To see the pipeline data for a specific stage, position the mouse pointer over that segment. When you do, CFO Dashboards displays the stage name, pipeline amount, and percentage of total pipeline.
Click Show Details to go to the Business Development dashboard to view and analyze business development at a more detailed level.
As Of Date
The Business Development Summary analytics reflect the pipeline amounts and bid and win rates as of today's date.
Pipeline Amounts
- The unweighted pipeline amount for a stage is the sum of the estimated revenue amounts for the opportunities currently assigned to the stage.
- The weighted pipeline amount for a stage is the sum of the weighted estimated revenue amounts for the opportunities currently assigned to the stage: Weighted estimated revenue = Estimated revenue X Probability
Use the Pipeline Probability Weighting options on the Business Development dashboard to switch between weighted and unweighted pipeline amounts. Use the Probability > option on the Business Development dashboard to include only opportunities with a win probability greater than a specified percentage.
Opportunities Included in Current Pipeline
Which opportunities are included in your current pipeline is based on the stage each opportunity is currently assigned to. Your system administrator specifies which stages are included in current pipeline, either when configuring Capture Analytics or, if your firm does not use Capture Analytics, when extracting data from an alternative data source. Opportunities assigned to a current pipeline stage are automatically included in the calculation of current pipeline amounts, and opportunities that are not assigned to one of those stages are not included.
For example, if your firm has a Won stage but does not want to include won contracts in current pipeline amounts, the system administrator does not include that stage, and the opportunities assigned to that stage are excluded from current pipeline amounts.
Bid Rate Calculation
- Number of bid opportunities / (Number of bid opportunities + Number of no-bid opportunities)
- Total estimated revenue for bid opportunities / (Total estimated revenue for bid opportunities + Total estimated revenue for no-bid opportunities)
Win Rate Calculation
- Number of won opportunities / (Number of won opportunities + Number of lost opportunities)
- Total estimated revenue for won opportunities / (Total estimated revenue for won opportunities + Total estimated revenue for lost opportunities)
Filter Options
- Opportunities that are associated with a specific company (if your firm has multiple companies in Costpoint)
- Opportunities that are associated with selected organizations. Use the
 icon at the top of the
Org filter list to display organization codes for all levels of the organization structure or only the organization codes for a specific level.
icon at the top of the
Org filter list to display organization codes for all levels of the organization structure or only the organization codes for a specific level.
- Opportunities with a win probability greater than a specified percentage
- Opportunities that are associated with selected clients
- Specific types of opportunities
If the Business Development Summary Is Not Visible
If your firm decides to not load the necessary pipeline data into the CFO Dashboards data model, the Business Development Summary does not display.