Analytic Areas
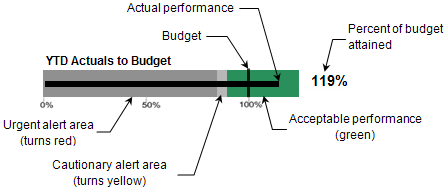
Revenue — The graph provides a visual comparison of current year-to-date, quarter-to-date, or period revenue to the current budget. The table compares the current to-date revenue amount to the budget and displays the variance. For additional analysis, the table also provides prior year revenue and budget amounts for the same period, and the projected year-end or quarter-end revenue and budget amounts. More...
Profit — The graph provides a visual comparison of current year-to-date, quarter-to-date, or period profit to the current budget. The table compares the current to-date profit amount to the budget and displays the variance. For additional analysis, the table also provides prior year profit and budget amounts for the same period, and the projected year-end or quarter-end profit and budget amounts. More...
Backlog — The graph provides a visual comparison of backlog, as of the end of the current fiscal period, to the current backlog budget. The table compares the backlog amount, as of the end of the current period, to the budget and displays the variance. For additional analysis, the table also provides prior year backlog and budget amounts as of the same period, and the projected year-end or quarter-end backlog and budget amounts. More...
Projects at Risk — This table displays the following for the five risk reasons with the highest at-risk amounts: at-risk amount as of the current fiscal period, percentage change from the preceding period, and number of at-risk projects. More...
Labor Utilization — The graph provides a visual comparison of the current year-to-date, quarter-to-date, or period labor utilization rate to the current budget or target utilization rate. The table compares the current to-date utilization rate to the budget or target and displays the variance. For additional analysis, the table also provides prior year utilization rate and budget rate as of the same period. More...
Pipeline — The table provides a comparison of the current pipeline, broken down by stage, to the pipeline amounts for the prior week or month. The Variance column displays the percentage of change between the two amounts, and the arrows in the last column indicate the trend direction for each stage. (Pipeline summary analytics are only displayed if you have Capture Analytics.) More...
AR and Current DSO — The AR pie chart provides a breakdown of total current AR by aging range. Below the chart is the total AR amount, and the current days sales outstanding (DSO) value. More...
How to...
![]() Specify the analysis period — Use the Year, Quarter, and Period options at the top of the tab to change the analysis period reflected in the analytics.
Specify the analysis period — Use the Year, Quarter, and Period options at the top of the tab to change the analysis period reflected in the analytics.
![]() Select user options — Use the User Options tab to specify the general data options you want to apply to the Summary Analytics.
Select user options — Use the User Options tab to specify the general data options you want to apply to the Summary Analytics.
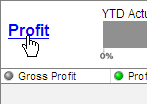
![]() Display detailed analytics — Click the label for a summary area to display the detailed analytics for that area. For example, to go to the detailed analytics for profit, click Profit.
Display detailed analytics — Click the label for a summary area to display the detailed analytics for that area. For example, to go to the detailed analytics for profit, click Profit.
![]() Filter by organization or reorganization — Use the Owning Org or Owning Reorg lists to filter the contents of the analytics by owning organization or reorganization. When you display the analytics initially, they display summary data for all of the organizations or reorganizations to which you have access.
Filter by organization or reorganization — Use the Owning Org or Owning Reorg lists to filter the contents of the analytics by owning organization or reorganization. When you display the analytics initially, they display summary data for all of the organizations or reorganizations to which you have access.

