|
The Revenue summary analytics include the following:
If your review of the summary revenue data suggests the need for more detailed analysis, click Revenue to go to Costpoint Analytics - Projects. If you have not been given access to revenue information in Costpoint Analytics, the Summary Dashboard tab does not display the Revenue summary area. |
In this topicUser Options That Affect the Revenue Summary
|
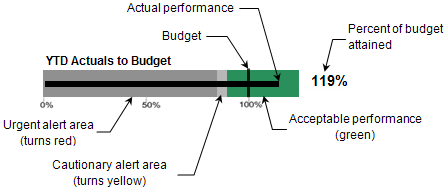
The Revenue analytic area includes a bullet graph to give you a visual comparison of revenue to budget for the analysis period. The center column of the table below the bullet graph in the Revenue summary area displays the revenue and budget amounts on which the graph is based.

|
Graph Item |
Description |
|
Horizontal bar (black) |
The black horizontal bar represents the revenue for the analysis period (for example, year-to-date revenue). If you position the mouse pointer at any point on this bar, Costpoint Analytics displays the revenue budget amount, the revenue amount and percentage of budget at which the cautionary alert is triggered, and the revenue amount and percentage of budget at which the urgent alert is triggered. |
|
Vertical bar (black) |
The black vertical bar represents the revenue budget or forecast for the analysis period (for example, year-to-date revenue budget). |
|
Percent Attained |
The percentage to the right of the graph is the percentage of budget attained for the analysis period: (Revenue / Budget or forecast) × 100. |
|
Percentage scale |
The scale along the bottom of the graph indicates percentage of budget. |
|
Alert areas |
The graph background is divided into alert areas based on tolerance percentages that your system administrator established for revenue:
|
|
Data Item |
Description |
|
Revenue: Prior Year |
Year-to-date, quarter-to-date, or period revenue for the current period in the prior year. |
|
Baseline Budget/Forecast: Prior Year |
Year-to-date, quarter-to-date, or period revenue budget for the current period in the prior year. |
|
Revenue: YTD/QTD/Period |
Year-to-date, quarter-to-date, or period revenue for the current period in the current year. |
|
Baseline Budget/Forecast: YTD/QTD/Period |
Year-to-date, quarter-to-date, or period revenue budget for the current period in the current year. |
|
Variance: YTD/QTD/Period |
Year-to-date, quarter-to-date, or period revenue variance from budget. If the percent attained falls within the cautionary alert range or urgent alert range, Costpoint Analytics displays the variance within a colored border to draw your attention to it. A yellow border indicates a cautionary alert, and a red border indicates an urgent alert. |
|
Revenue: Projected Year End/Projected Qtr End/YTD |
Projected year-end or quarter-end revenue, based on revenue through the current period and the budget for the remainder of the year or quarter. If the analysis period is just the current period, this column displays year-to-date revenue through the current period. |
|
Baseline Budget/Forecast: Projected Year End/Projected Qtr End/YTD |
Year-end or quarter-end revenue budget. If the analysis period is just the current period, this column displays the year-to-date revenue budget through the current period. |
Costpoint Analytics first calculates revenue for ![]() revenue-level projects and then rolls up those revenue amounts and corresponding budget amounts to determine the summary revenue data displayed on the Summary Dashboard tab.
revenue-level projects and then rolls up those revenue amounts and corresponding budget amounts to determine the summary revenue data displayed on the Summary Dashboard tab.
Revenue amounts in Costpoint Analytics can be calculated using either actual or target rates. During the configuration process for Costpoint Analytics, your system administrator selects the option your firm will use. That selection applies to all analytics that either display revenue amounts or use them to derive other values.
If prior year revenue adjustments are included in the PSR tables, revenue amounts may include those revenue adjustments, depending on how Costpoint Analytics is configured. For more information, see Adjustment Period.
Revenue budget data on the Summary Dashboard tab does not include proposals. If your firm has loaded proposal data, go to the detailed Revenue Analytics if you want to include proposal data in your analysis.
For more on how Costpoint Analytics calculates revenue, see Revenue Analytics: Data Sources.
Your selections on the User Options tab affect the revenue summary in the following ways:
|
User Option |
Effect on the Analytics |
|
Budget Type |
Use the options under Budget Type to specify the budget data to which you want to compare actual performance:
|
|
Org or Reorg |
Use the options under Org or Reorg to indicate if you want to view data based on the organization structure or based on a reorganization:
|