Resource Histogram View
A resource histogram view displays resource and cost data against a time scale.
Resource histogram views are especially useful for modeling project resources since they allow you to compare resource assignments to availabilities as well as allow you to view the overall usage of a resource (or a group of resources) over the time span of the project.
Resource histogram views allow you to display the following types of resource information in a graphical format:
- Resource availabilities
- Resource assignments based on the early dates calculated by time analysis
- Resource assignments based on the late dates calculated by time analysis
- Resource assignments based on the scheduled dates calculated by resource scheduling (these assignments can show the effects of splitting, stretching, and reprofiling activities)
- Baseline resource assignments using the dates (early, late, or scheduled) selected at the time you created the baseline currently attached to the project
- Actual resource usage based on resource progress information
You can use a resource histogram view to display any of these items individually, or you can display more than one at the same time.
The options that define how resource information appears in a view are found on the Resources tab of the Histogram Preferences dialog box.
Open Plan can display the histogram both as a stand-alone view and as a pane on the barchart view. If you are displaying the histogram as a stand-alone view, the date scale is at the bottom of the view and typically starts at the earliest instance of relevant project data. When you display a histogram with a barchart, the date scale for the barchart controls the display of histogram bars.
Each bar in the histogram represents a value corresponding to the smallest time unit displayed on the date scale. For example, if you define a date scale with a single axis showing weeks, you can display bars that show how many units of the selected resource are required during each week. In this way, you can display resource assignments and costs aggregated on an hourly, daily, weekly, monthly, quarterly, or yearly basis.
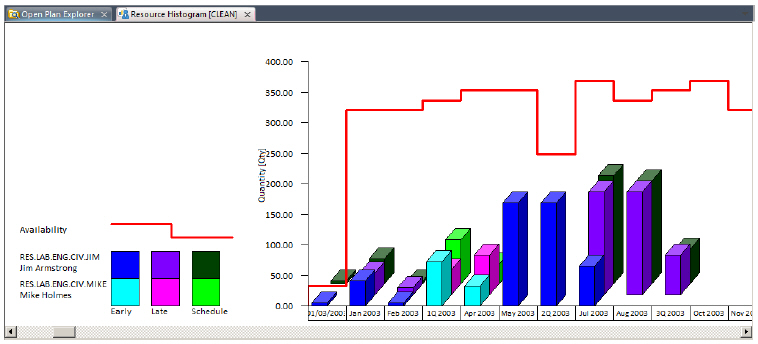
A legend that explains the colors used for the bars is displayed at the left side of the histogram view.
Sometimes, the legend is not immediately visible when the histogram is displayed as part of a barchart view. To display the legend in these circumstances, drag the vertical line separating the spreadsheet from the bar portion of the view to the right.
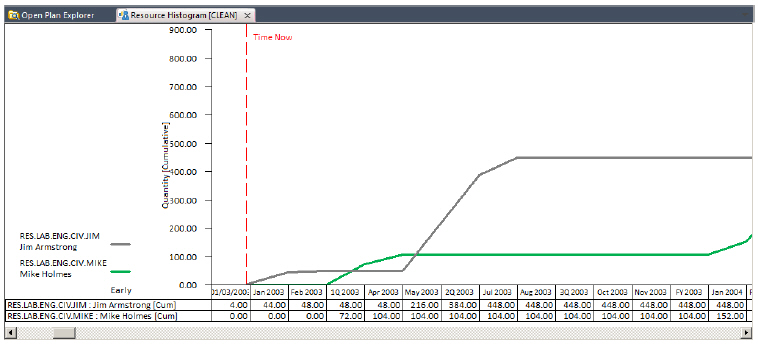
It is also possible to have a histogram view display a representation of Time Now by setting an option on the Options tab of the Histogram Preferences dialog box.
If you prefer to see the precise values represented in the view, you can configure a histogram to display information in a tabular format below the bars. It is also possible to display just the tabular portion of the view.
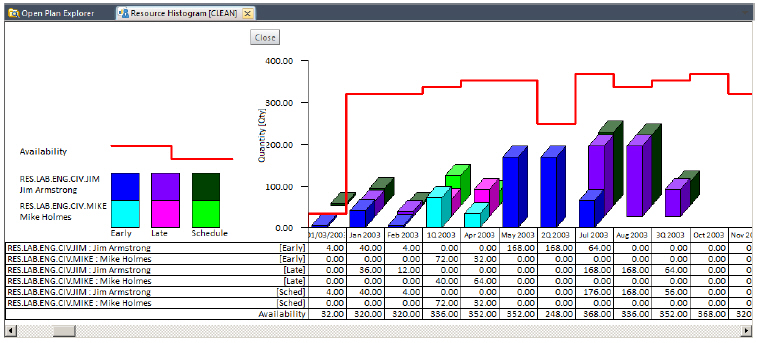
As in the case of histogram bars, the aggregation of tabular data corresponds to the smallest unit displayed on the date scale.
In addition to displaying information aggregated on a period-by-period basis, you can display cumulative curves in a resource histogram view. This feature is especially useful for creating S-curves for earned value and cost reporting.
Note that in views that combine both histogram bars and S-curves, the vertical axis for the histogram bars appears on the left, while the vertical axis for the S-curve appears on the right. The legend to the left of the date scale tells you the type of information represented by the bars and S-curves.
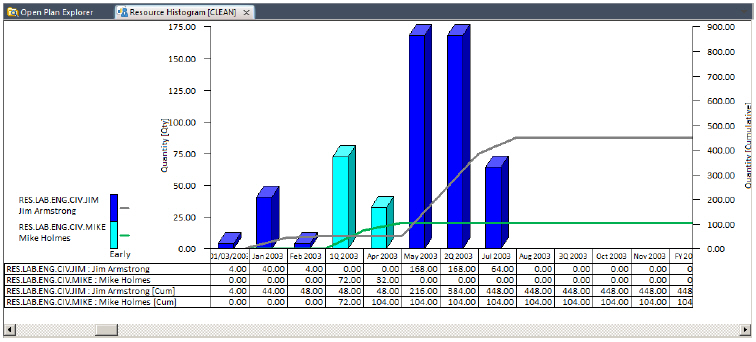
In views that combine both histogram bars and S-curves, the vertical axis for the histogram bars appears on the left, while the vertical axis for the S-curve appears on the right.
Displaying a Resource Histogram
To display a resource histogram in Open Plan, the following conditions must be met:
- You have assigned a resource file to a project.
- The project has at least one activity with a resource assignment.
- You have selected a resource to display. (Use the Select Resource command from the View tab to indicate your selection.)
If you are only interested in showing resource or cost information based on early or late dates, you do not have to perform resource scheduling to display a resource histogram.
Resource Histogram Preferences
Use the Histogram Preferences dialog box to set the resource histogram parameters of a project.