Risk Histograms
A risk histogram view presents the detailed picture of the probability distribution for calculated dates for a key activity.
Open a risk histogram view, select a key activity from the project, then select any of the following dates for use in a risk histogram view:
- Early start
- Early finish
- Late start
- Late finish
The following is an example of a risk histogram based on early start dates.
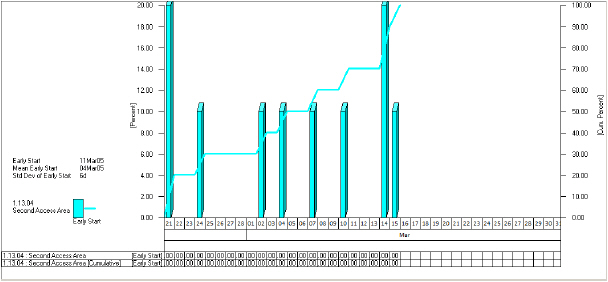
The histogram represents the percentage of trials which resulted in an early start within each time interval. Against the left-hand axis, Open Plan prepares a scale representing the percentage of risk analysis iterations that occurred in a given time interval. In this example, the mode or “most likely” early start for the activity was May 5 with 40% of the simulations falling in that interval.
The right-hand axis represents the cumulative distribution of the dates. In this example, we can see that 50% of the simulations resulted in dates no later than May 5, making it the median early start date.
Notice also how Open Plan displays the following information to the left of the histogram:
- The early and late start dates (calculated by time analysis)
- The mean early and late start dates
- The standard deviation for the mean early start
- The standard deviation for the mean late start