Hours Analysis Tab
The Hours Analysis tab enables you to compare actual hours worked against the planned hours for each project.
It helps monitor labor performance and identify potential issues. This dashboard uses Project Planning data. Click the info icon in the upper-right corner of any chart or table to see a quick explanation of what it shows and how to use it.
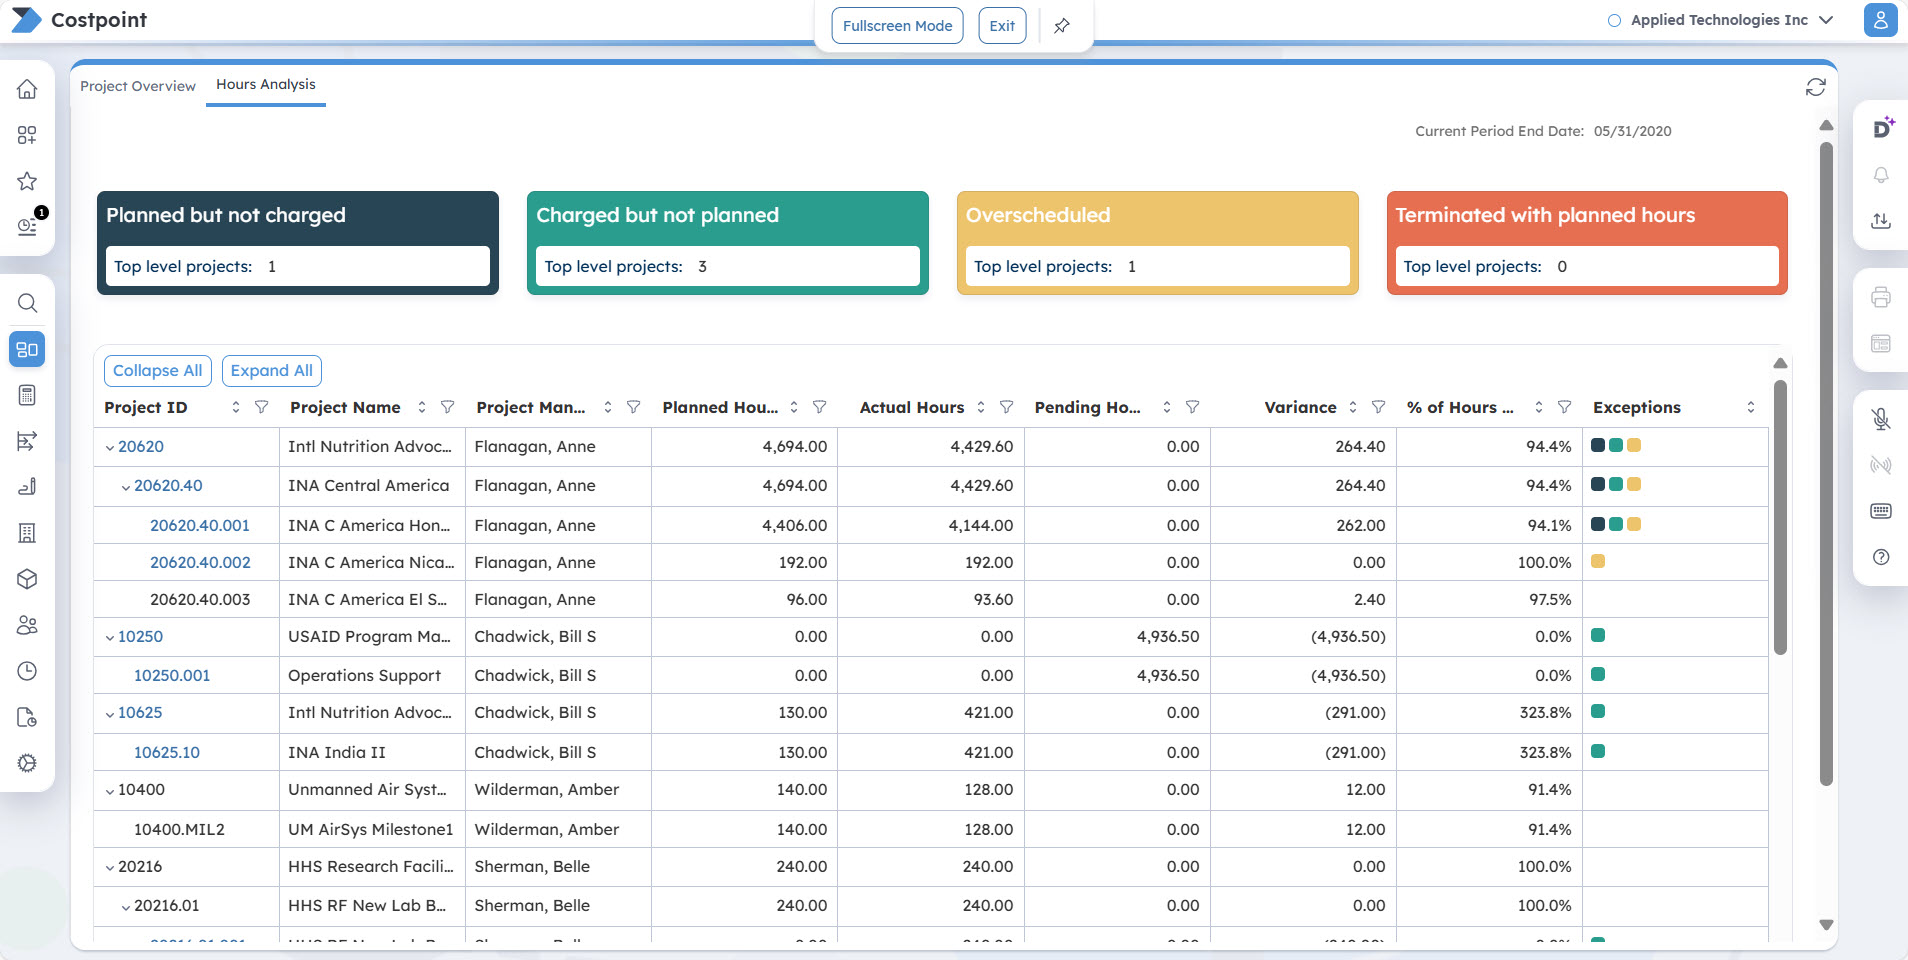
When you open the tab, you'll see four summary panels that highlight potential project resourcing issues. Each colored card displays the number of top-level projects in key exception categories:
| Field | Description |
|---|---|
| Planned but not charged |
This displays top-level projects where resources have been planned but no hours have been charged yet. |
| Charged but not planned |
This displays top-level projects where resources have charged hours even though they weren't originally planned for that project. |
| Overscheduled |
This displays top-level projects where employees are overscheduled across multiple projects during the reporting period. Note: Overscheduling occurs when an employee's assigned hours exceed their capacity by more than 10%.
|
| Terminated with planned hours |
This displays top-level projects with planned hours assigned to employees whose termination date falls within or after the current period. |
| Current Period End Date |
This is based on the End Date set on the Manage Current Reporting Period screen. |
Hours Analysis Table
This section provides a summary of hours by project. Use the following controls above the table to customize your view:
| Field | Description |
|---|---|
| Collapse All |
Click this button to collapse grid information. |
| Expand All |
Click this button to expand grid information. |
| Clear All Filters |
Click this button to clear all the filters you selected. |
The table includes the following columns:
| Field | Description |
|---|---|
| Project ID |
This column displays the project ID. You can click the arrow icon to drill down up to the fourth level of the project. This is a clickable link that opens the Project Resource Exceptions report on a new tab. Use the Export Report drop-down list in the upper-right corner of the Command Center screen to export the Project Resource Exceptions report in HTML, PDF, Excel, Excel Data, CSV, or XML format. |
| Project Name |
This column displays the project name. |
| Project Manager |
This column displays the project manager assigned to the project. |
| Planned Hours |
This column displays the planned hours entered in Planning, which are based on the final EAC. If there is no final EAC, it is based on the final BUD. |
| Actual Hours |
This column displays the actual hours that have been charged to the project. |
| Pending Hours |
This column displays timesheet hours that have been entered but not yet posted. |
| Variance |
This column displays the difference between Planned Hours and the sum of Actual Hours and Pending Hours. |
| % of Hours Used |
This column displays the percentage of hours used. |
| Exceptions |
This column displays colored indicators corresponding to each exception category. Hover over an indicator to see the category name. The table is sorted by the number of exceptions, so projects with more exceptions display at the top. |
Project Resources Exceptions
When you click the Project ID on the Hours Analysis table, it drills down into the Project Resources Exceptions report.
This report is similar in layout to the Hours Analysis dashboard tab but focuses on individual resources instead of projects. It provides detailed information about resources that fall under the exception categories.
The main difference is in the table columns, which include:
- Resource: This displays the employee name and links to the Resource Planning application.
- Project ID: This links to the Project Budgets/EAC application for viewing and updating project budget details.
You can also click the colored indicators in the Exceptions column to open the corresponding Costpoint application.