Billing Tab
The Billing tab helps you monitor unbilled balances, identify billing setup issues, and assess project financial performance in real time.
It also links to corresponding Costpoint applications and BI reports. Click the info icon in the upper-right corner of any chart or table to see a quick explanation of what it shows and how to use it.
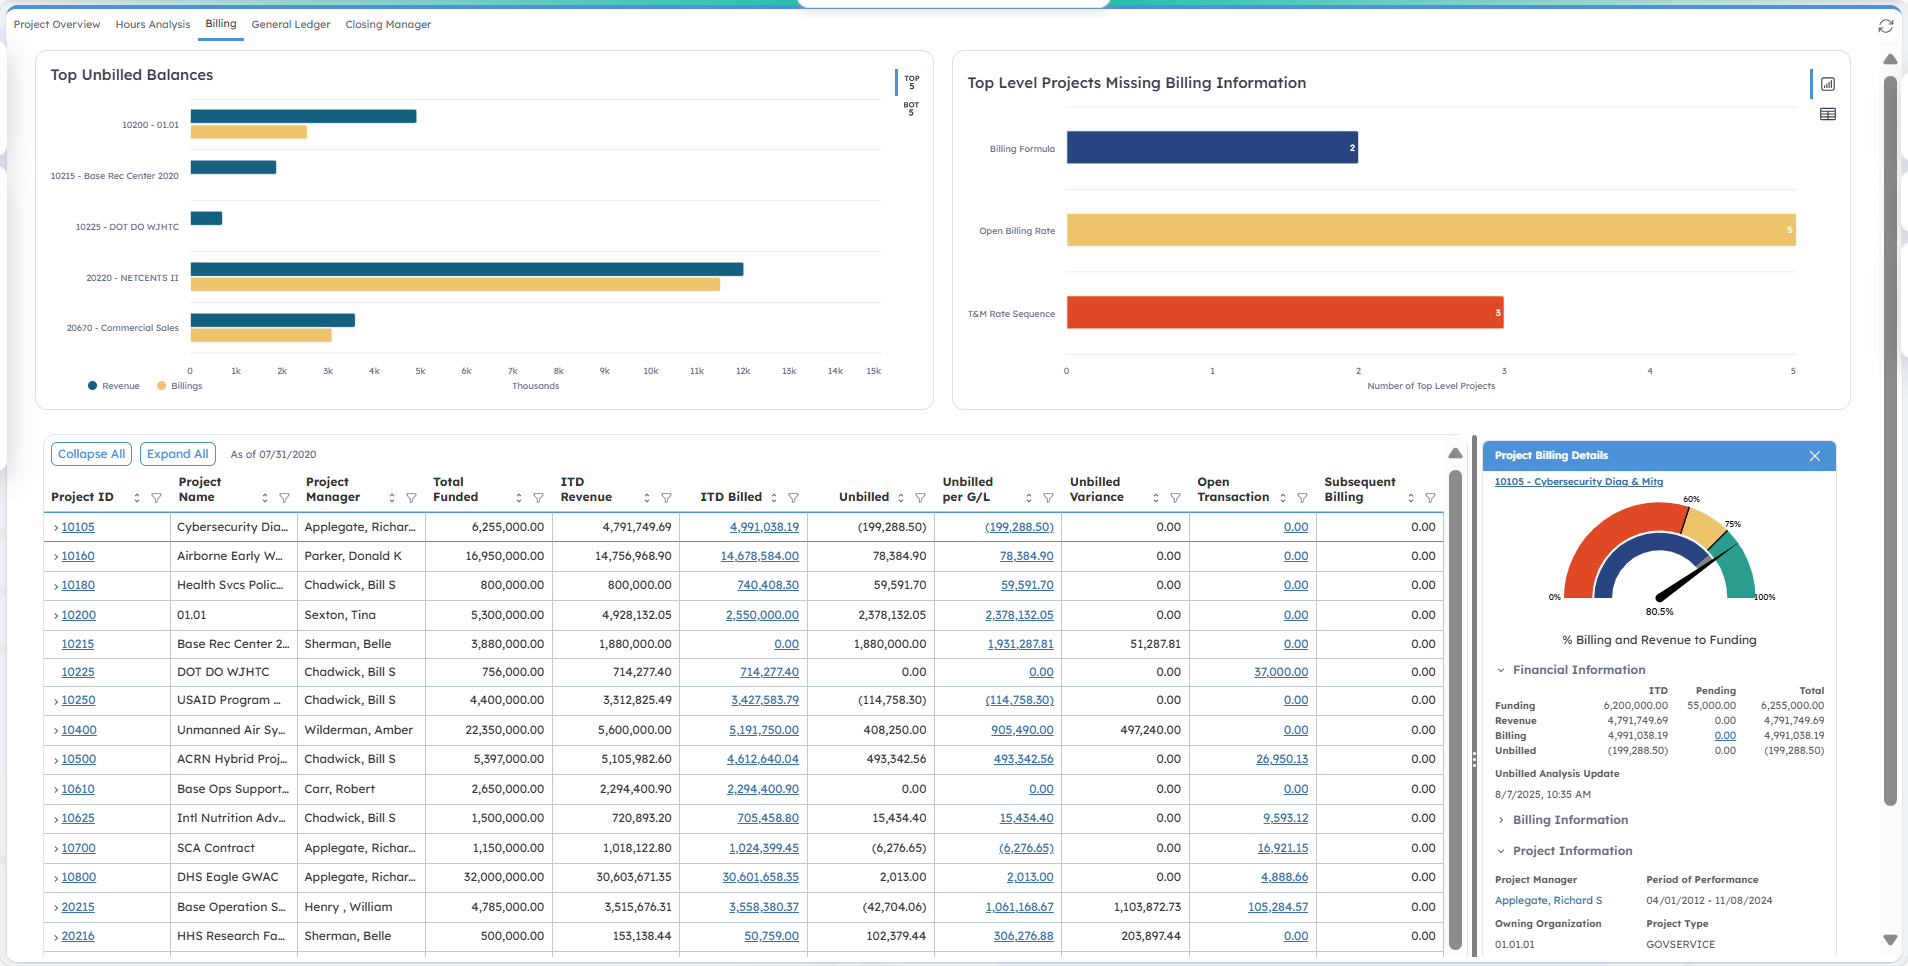
Top/Bottom Unbilled Balances
This horizontal bar chart enables you to quickly identify projects with the largest variances between revenue and billings. Use the toggle buttons in the upper-right corner of this section to switch between the Top 5 and Bottom 5 projects with unbilled balances.
Each project has two bars: Revenue and Billings. Hover over each bar to display the project's ITD Revenue, ITD Amount Billed, and Unbilled values. Use this information to compare revenue earned against billings issued and identify projects that may require billing follow-up or reconciliation.
Top Level Projects Missing Billing Information
This bar chart and table identify top-level projects with missing or incomplete billing setup data, which need to be fixed to ensure accurate invoices. Use the icons in the upper-right corner to switch between the bar chart and table views. The table view lists the specific projects with missing billing information.
The horizontal bar chart displays how many top-level projects are missing billing information in each category. For each missing type, the chart counts a project once if any required billing information is missing at lower levels, regardless of how many levels are affected. This ensures the chart provides a clear, high-level overview without overstating the issue.
For example, if Billing Formula is missing across multiple levels within a project, the chart counts it as 1 for the associated top-level project. If the revenue level is undefined or missing, Command Center treats the setup as incomplete for the top-level project, rather than attempting to count missing items at lower levels.
Clicking a bar filters the table to display only projects missing that specific data. From the filtered table, click Missing Type to open the relevant application and update the data. You must have rights/access to the application to be able to open it. The linked application varies by missing data type:
- ,
Manage Project Labor Categories (PLC), or
Link PLC Rates to Employee/Vendor
Note: The Missing Open Billing Rate is a dynamic link that directs you to one of these three Costpoint applications, depending on the project's rate sequence setup.
Unbilled Grid
This table provides detailed insight into key financial metrics to help you monitor and assess project billing performance. It shows data at the top-level project and expands to the unbilled-level project, which is the higher of the billing or revenue level. The table also displays unbilled balances and highlights variances between unbilled amounts in the Project Ledger and General Ledger.
Use the following controls above the table to customize your view:
| Field | Description |
|---|---|
| Collapse All |
Click this button to collapse grid information. |
| Expand All |
Click this button to expand grid information. |
| Clear All Filters |
Click this button to clear all the filters you selected. |
| As of [date] |
The data displayed in this table is based on the End Date set on the Manage Current Reporting Period screen, which is maintained by your administrator. The active reporting date is displayed at the top of the table header (for example, As of 05/31/2020). |
The table includes the following columns:
| Field | Description |
|---|---|
| Project ID |
This column displays the project ID. You can click the arrow icon to drill down to the revenue-level project. This is a clickable link that opens the Manage Project Billing Information application, where you can view and update detailed billing information. |
| Project Name |
This column displays the project name. |
| Project Manager |
This column displays the project manager assigned to the project. |
| Total Funded |
This column displays the total funded value, including award fee. |
| ITD Revenue |
This column displays the ITD revenue, including award fee. |
| ITD Billed |
This column displays the ITD billed amount. This is also a clickable link that opens the Project Billing History report on a new tab. Use the Export Report drop-down list in the upper-right corner of the Command Center screen to export the Project Billing History report in HTML, PDF, Excel, Excel Data, CSV, or XML format. |
| Unbilled |
This column displays the difference between the ITD Revenue and ITD Billed columns. |
| Unbilled per G/L |
This column displays the unbilled per general ledger amount. This is also a clickable link that opens the Unbilled per General Ledger Detail report on a new tab. Use the Export Report drop-down list in the upper-right corner of the Command Center screen to export the Unbilled per General Ledger Detail report in HTML, PDF, Excel, Excel Data, CSV, or XML format. |
| Unbilled Variance |
This column displays the difference between the Unbilled per G/L and Unbilled columns. |
| Open Transaction |
This column displays open transaction amounts. This is a clickable link that opens the Open Billing Detail report on a new tab. Use the Export Report drop-down list in the upper-right corner of the Command Center screen to export the Open Billing Detail report in HTML, PDF, Excel, Excel Data, CSV, or XML format. |
| Subsequent Billing |
This column displays the subsequent billing amounts. |
Project Billing Details
The Project Billing Details side panel is displayed when you click any row in the project list table. It displays the selected project's billing and financial information.
| Field | Description |
|---|---|
| Project ID - Project Name |
This is a clickable link that opens the A/R Aging Report for the selected project on a new tab. When you hover over this field, a tooltip labeled "Launch A/R Aging Report" is displayed. Use the Export Report drop-down list in the upper-right corner of the Command Center screen to export the A/R Aging Report in HTML, PDF, Excel, Excel Data, CSV, or XML format. |
| % Billing and Revenue to Funding |
This gauge chart displays the % Billing and Revenue to Funding. Hover over the color-coded elements to display the ITD Funding and Total Revenue amounts, and the gauge needle to display the Total Billing amount. |
Financial Information
| Field | Description |
|---|---|
| Funding |
This displays the ITD, Pending, and Total funding values. Pending refers to future modifications or changes that take effect after the current BI reporting period. |
| Revenue |
This displays the ITD, Pending, and Total revenue values. Pending revenue is the estimated revenue from transactions that have been entered but not yet posted. It helps provide more real-time insight into the % Revenue to Funding calculation. Optionally, to populate the Pending Revenue column, run the Update Pending Report Tables application. Important: As a best practice, it is recommended to update pending transactions, PSR, revenue, and burdens daily. If you update the pending transactions daily but only update the PSR weekly, some transactions may not be displayed in either data set. Posted transactions will drop from the pending table but won't be displayed in the PSR until its next update. Make sure your process timing is aligned to avoid data gaps.
|
| Billing |
This displays the ITD, Pending, and Total billing amounts. Click on the Pending Billing value to open the Unposted Invoices report on a new tab. Use the Export Report drop-down list in the upper-right corner of the Command Center screen to export the Unposted Invoices report in HTML, PDF, Excel, Excel Data, CSV, or XML format. Pending billing are bills that have been calculated and selected for posting but not yet posted. |
| Unbilled |
This displays the ITD, Pending, and Total unbilled amounts. |
| Unbilled Analysis Update |
This displays the most recent date and time when the unbilled data was last refreshed. |
| Project Status Update |
This displays the most recent date and time when the pending revenue data was last refreshed, based on the source table used for Pending Revenue. |
Billing Information
This section displays the billing information set up on the Manage Project Billing Information screen. If the project selected is not an invoice project, this section displays the following: "Not an Invoice Project."
| Field | Description |
|---|---|
| Customer(s) |
This displays the customer's name that is entered on the Manage Project Billing Information screen. |
| Biller/Bill User Group |
This displays the billing user group associated with the project. |
| Billing Formula |
This displays the billing formula for the project. |
| Billing Format |
This displays the format of the project. |
| Billing Cycle |
This displays the billing cycle. |
| Billing Address |
This displays the billing address. |
| Income State |
This displays the state code that is identified with the project for tax purposes. |
Project Information
| Field | Description |
|---|---|
| Project Manager |
This displays the project manager assigned to the project. Click the name to send an email to the project manager using your default email application. |
| Period of Performance |
This displays the period of performance dates. |
| Owning Organization |
This displays the owning organization. |
| Project Type |
This displays the project type. |
| Project Customer Name |
This displays the project's primary customer. |