Inventory Dashboard
Use the Inventory Dashboard data to make decisions about inventory value, obsolete inventory levels, negative available inventory, and count accuracy.
Inventory Tab
The Inventory Tab provides data to help you analyze your inventory. You can also filter the data based on project, organization, warehouse, and part.
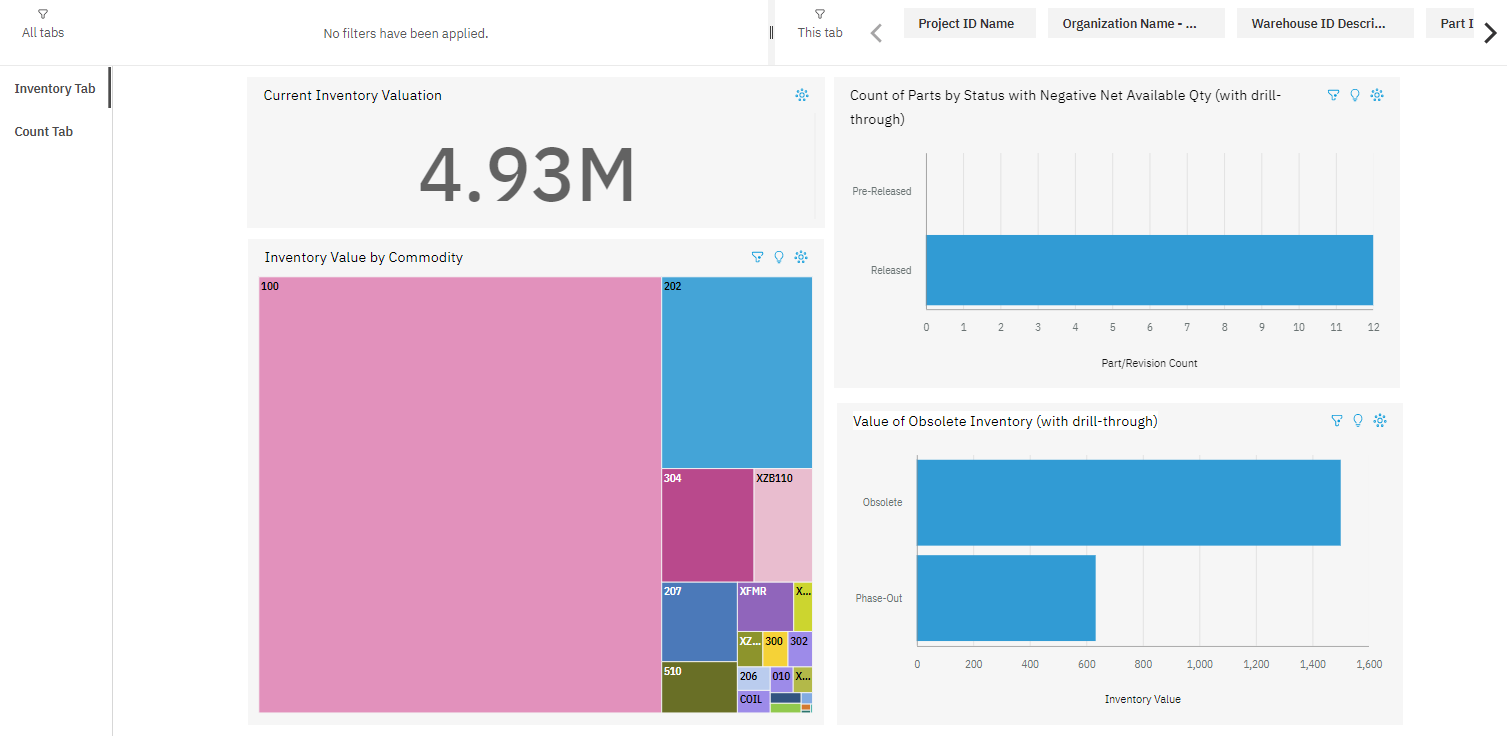
- Current Inventory Valuation: This KPI value is the total value of current inventory.
- Count of Parts by Status with Negative Net Available Qty (with drill-through): This KPI value shows the number of parts by status that have a negative net available quantity. This chart has a drill-through report that shows the list of these parts and their on-hand and available quantity. Click the Part ID to see a list of Manufacturing Orders for Make parts or Purchase Requisitions and Purchase Orders for Buy parts, and to see where these items are on order to come in.
- Inventory Value by Commodity: This pie chart shows the total inventory value by commodity.
- Value of Obsolete Inventory (with drill-through): This bar chart displays the value of obsolete inventory based on the following criteria:
- Obsolete part status
- Phase-Out part status
The drill-through report shows a list of the parts along with the on-hand quantity, unit cost, and total value of each obsolete and phased-out status.
Count Tab
The Count Tab provides inventory count data that you can filter by location, part, count ID, warehouse, the employee who performed the count, inventory abbreviation code, and counted date.
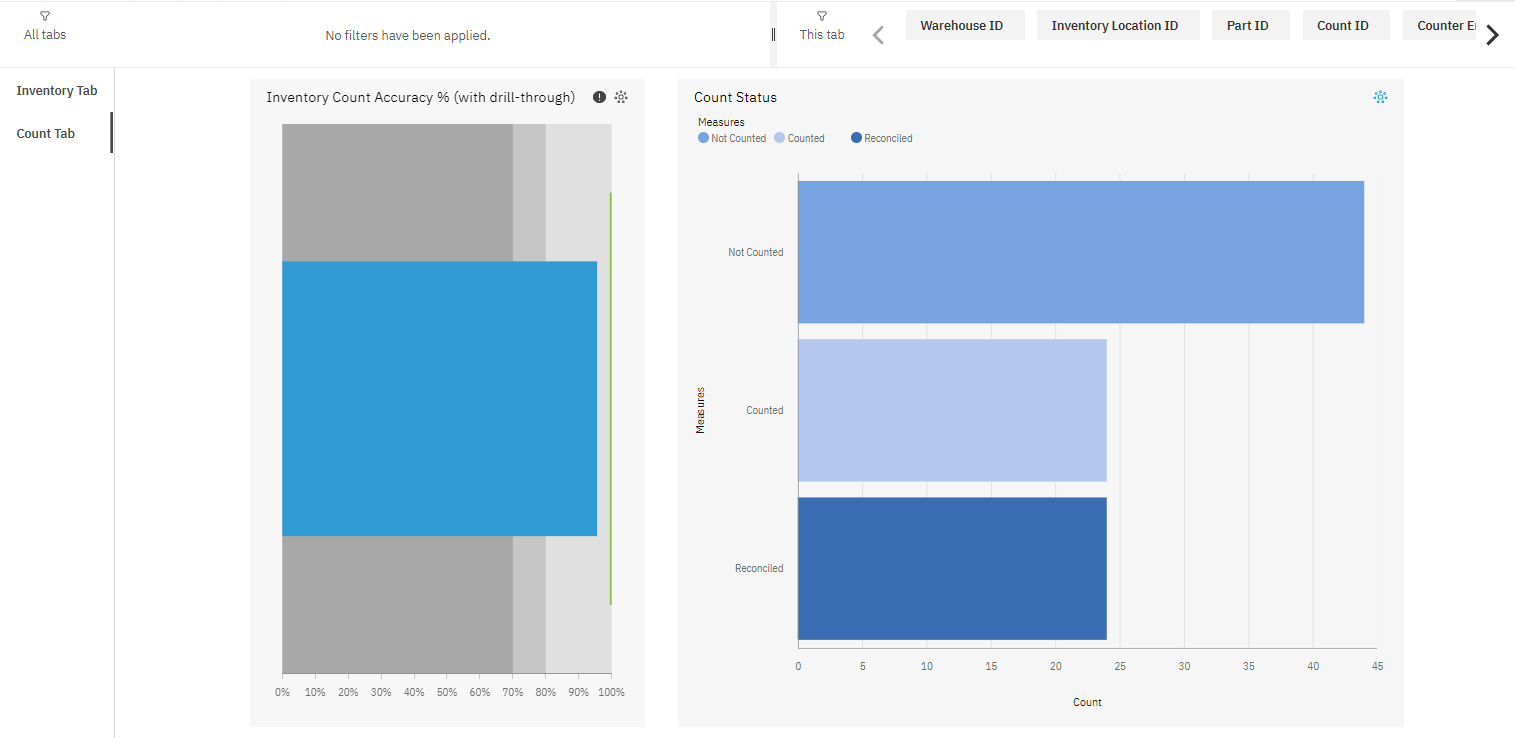
- Inventory Count Accuracy % (with drill-through): This KPI component shows the inventory count accuracy percentage based on Actual Count data. Drill through to the Inventory Count Accuracy report and view the actual count data to see the variance amount, unit cost, and whether the variance has been reconciled.
- Count Status: This bar chart shows the number of active counts in different statuses (Counted, Not Counted, and Reconciled).