| Field | Description |
|---|
| Report Name
|
You can change the default report name.
|
| Period Scale
|
Select one of the following period scales.
-
Daily
-
Weekly
-
Bi-Weekly — A two-week period.
-
Semi-Monthly — One semi-monthly period runs from the first to the fifteenth of the month. The second semi-monthly period runs from the sixteenth to the end of the month.
-
Monthly
-
Accounting Period
-
Quarterly
-
Yearly
For example, if you want the report to display monthly totals of hours or amounts, select
Monthly.
|
| Start Day of the week
|
If you select
Weekly or
Bi-Weekly in
Period Scale, select the starting day of the week.
The default selection is the day specified in
Starting Day of Week on the Plan Settings form ().
|
| Decimal Setting
|
Select the number of decimal digits to display for amounts:
-
No Decimal — The report displays numbers without decimal digits (12).
-
1 Digit — The report displays numbers with one digit to the right of the decimal point (12.1).
-
2 Digits — The report displays numbers with two digits to the right of the decimal point (12.13).
|
| Range
|
Select the number of reporting periods to display. The maximum number is 20.
This option determines the number of periods, and the
Period Scale option determines the type of period. For example, if you select
Monthly in
Period Scale and
6 in
Range, the report displays data for six monthly periods.
|
| Column Width
|
Enter the width of the data columns in inches or millimeters based on which one you selected in the
Unit of Measure field on the report Options Layout tab.
|
| Maximum Task Level
|
Select the number of task levels to include. The maximum number is 12.
For example, you have a plan with the following rows:
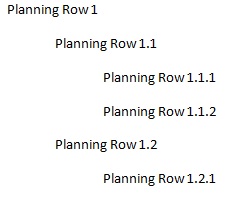
If you select
1 in
Maximum Task Level, the report only displays Planning Row 1.
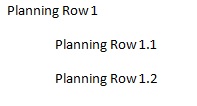
If you select
2 in
Maximum Task Level, the report displays the following:
|
| Start Date
|
Select the starting date for the data on the report:
-
Today — The report displays data starting with the current date.
-
Specific Date — The report displays data starting with the date you specify. Enter the date, or click
 and select the date. and select the date.
|
| Only include plans marked for Utilization and Project Reports
|
If you select this option, the report includes only those plans that you select in the Plan Lookup dialog box for which the
Include in Utilization and Project Reports option is selected on the General tab of the Project Planning form.
If you do not select this option, the report includes all plans that you select in the Plan Lookup dialog box.
|
| Consolidate by Plan Number
|
If your plan numbers have a standard structure, select this check box to summarize data based on that structure. In
Roll Up __ Digits on Left and
Roll Up __ Digits on Right, enter the number of characters that you want to roll up on the left and right ends of the plan numbers.
For example, if your plan numbers contain five characters and the first two characters of each plan number represent the client firm, you can consolidate (roll up) information at the client firm level. To do that, enter
3 in
Roll Up __ Digits on Right.
|
| Show Gantt Chart
|
Select this check box to display a Gantt chart (bar chart) on the report.
|
| Only Include Tasks with Planned Numbers
|
If you select this check box, the report includes only those tasks that have one or more of the following
- Planned hours
- Planned expense cost
- Planned consultant cost
This option is only available if you select the
Show Gantt Chart option.
|
| Show Predecessors
|
Select this check box to display the predecessor(s) for a task on the project plan.
|
| Show Relationships
|
Select this check box to display the relationship between a task and its predecessor(s).
|
| Show Lag/Lead
|
Select this check box to display the lag or lead time between a task and its predecessor(s).
|