Data Limitations and Performance
One of the uses for a data limitation is to improve People Planner's performance.
It turns out that the effectiveness of a data limitation is directly inversely proportional to how much data it lets through. The following graph is from a case study that was performed with a very large database.
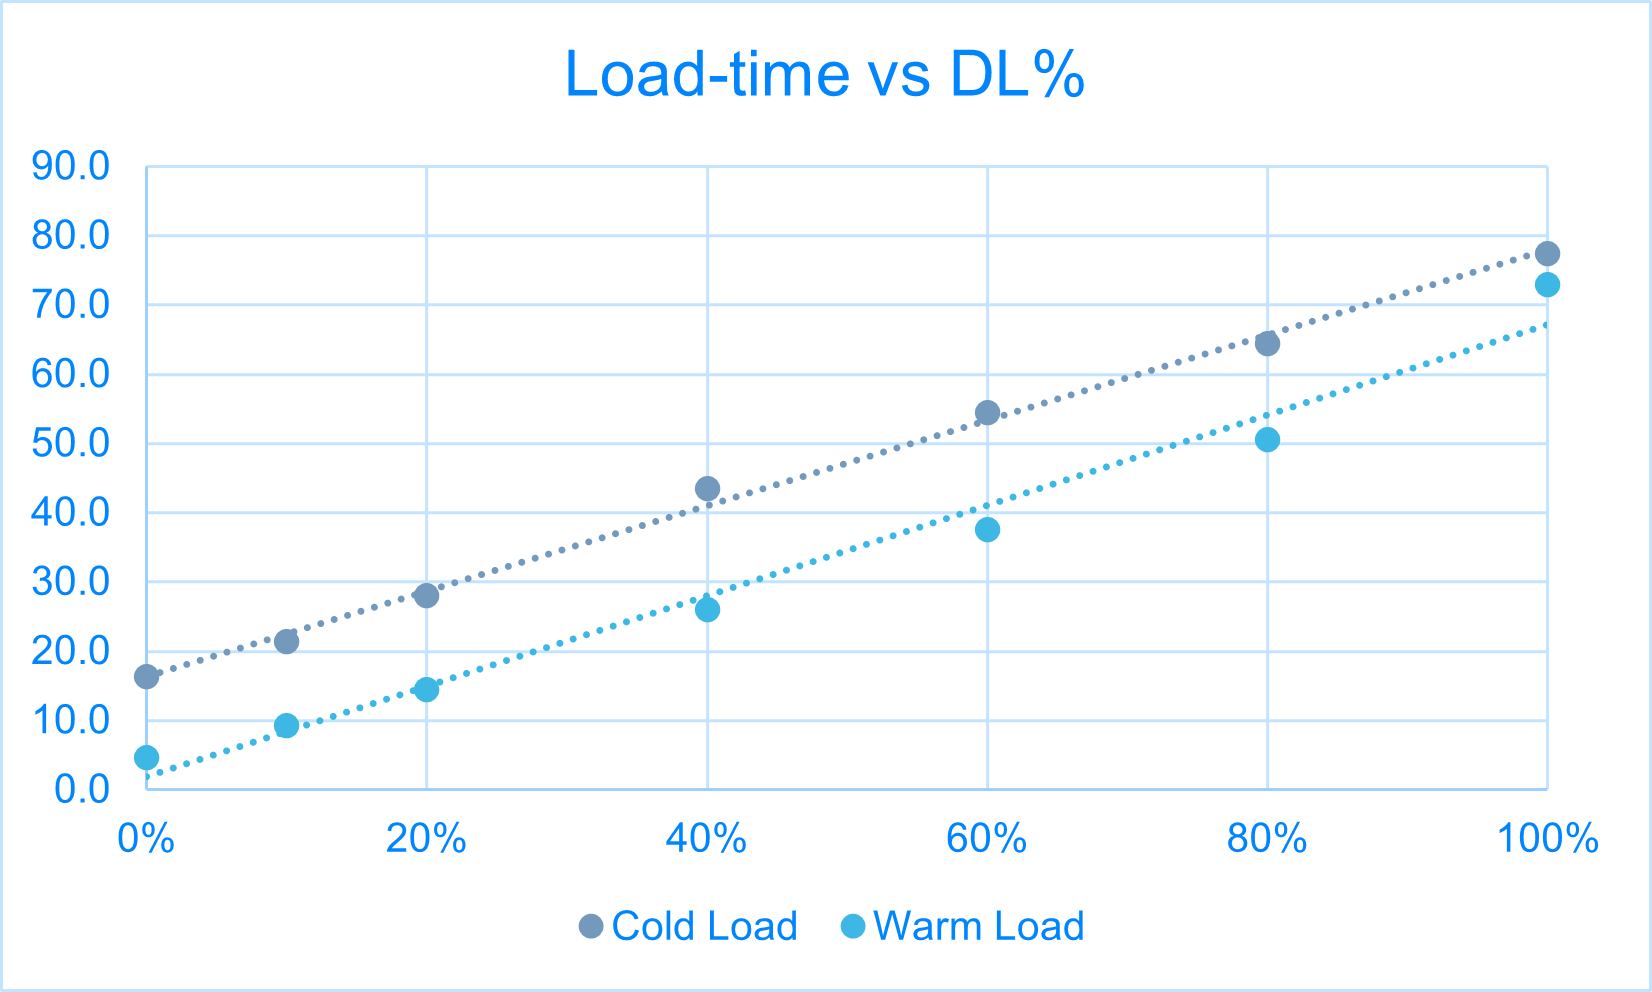
The scenario consisted of opening a perspective with a combined PG and RG and measuring how long this took. The numbers on the y-axis are the load times of the perspective in seconds.
These measurements were then repeated with different data limitations active. The numbers along the x-axis indicate how much data the active data limitation was letting through: 0% meaning that the data limitation was not letting any data through, and 100% meaning that the data limitation let all of the data through.
The two graphs clearly show that there was a linear relationship between how long it took to load the perspective and how much data the data limitation would let through. This relationship is indicated with the dotted trend lines.
The two graphs, Cold Load and Warm Load, refer to the cases where the People Planner application was just started or had been used for a while:
-
Cold Load: People Planner has just been started. No data is cached yet, either in the memory or in the SQL Server.
-
Warm Load: People Planner is now running, and the application has had time to cache the current working data in both the memory and in the SQL Server.
The graph for the Cold Load shows that the load time is not zero even if the data limitation hides all of the data. This is because there is always an overhead to starting up.
Given the linear nature of the graphs, this suggests a way to estimate how much data a data limitation must filter away to keep the load time below a specified threshold. You can simply measure how much time it takes to load the perspective with a data limitation that lets 0% through and with a data limitation that lets 100% through. Plot the two data points at 0% and 100% respectively, and draw a straight line between them. Use this line to estimate how much data the data limitation should hide for an acceptable load time.