
Barchart View
Since they provide an easy-to-understand graphical representation of important project dates, barcharts are widely used by many organizations to communicate information about the project schedule.
The interactive barchart views supplied with Open Plan are designed to facilitate the entry and display of scheduling information appropriate for many conventional types of projects. However, Open Plan also includes some powerful customizing features that allow you to prepare barcharts that meet any special requirements your organization might have.
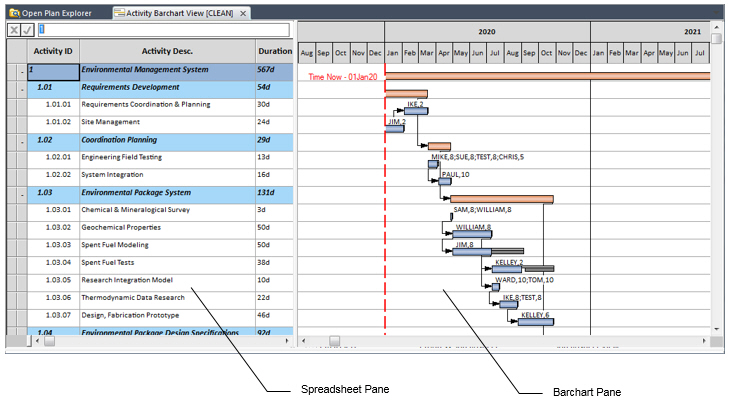
A barchart view displays activities in rows that appear in two panes. The pane on the left is a spreadsheet that displays information in a tabular format. The pane on the right displays information as bars against a time scale. Information about each activity is displayed on a single row. However, you can have any number of bars on a single row. For example, an activity row might contain one bar that shows early dates, another bar that shows scheduled dates, and still another bar that shows baseline dates.
Open Plan includes two types of barcharts; each of which is identified with a special icon.
Icon | Description |
|---|---|

| Single-table barcharts: Single-table barcharts display information from a single data table against a time scale. |

|
Multi-table barcharts: Multi-table barcharts can display information from more than one data table against a time scale. They allow you to display both activity and resource bars and multiple baselines. For example, you can show information about either the resources or the earned value of an activity as a bar that displays in addition to an activity bar. Provided that you have assigned resources to the project, multi-table barcharts can display resource usage and earned value in a third pane at the bottom of the barchart view. In addition, you can display resource assignment bars on the same row with activity bars. Open Plan includes two standard multi-table barchart views:
Both types of views allow you to display time-phased cost data aggregated by the barchart date scale Resource bars based on early and late dates take into account assignment information such as offsets and periods. Bars based on scheduled dates display a single segment for each record of usage. You can control the display of resource and activity bars using the Bar Attributes tab of the Bar Set Preferences dialog box. To control the display of time-phased cost data, use the Crosstable tab of the Bar Set Preferences dialog box. Attention: For information about customizing the appearance of resource bars and time-phased data in a multi-table barchart, see "Customizing Barchart Views" in the Deltek Open Plan Developer’s Guide.
|
You can define bars for any number of different criteria. Barcharts that use these bars can then be displayed on either edition of Open Plan.
Because bar styles can represent a wide variety of criteria, a barchart view can provide a great deal of information about your project at a glance.
A barchart is sometimes called a Gantt chart.
Related Topics
- How a Barchart Displays Information
- Customizing a Barchart View
- Customizing the Date Scale
- Working with Activities in a Barchart View
- Bar Data Mode and Relationship Mode
- The Spreadsheet Pane
- Reporting Calendars in the Barchart View
Related Procedures
- Create an Activity in a Barchart View
- Edit an Activity
- Create a Relationship in a Barchart View with a Mouse
- Create a Relationship in a Barchart View with the Keyboard