Project Overview Tab
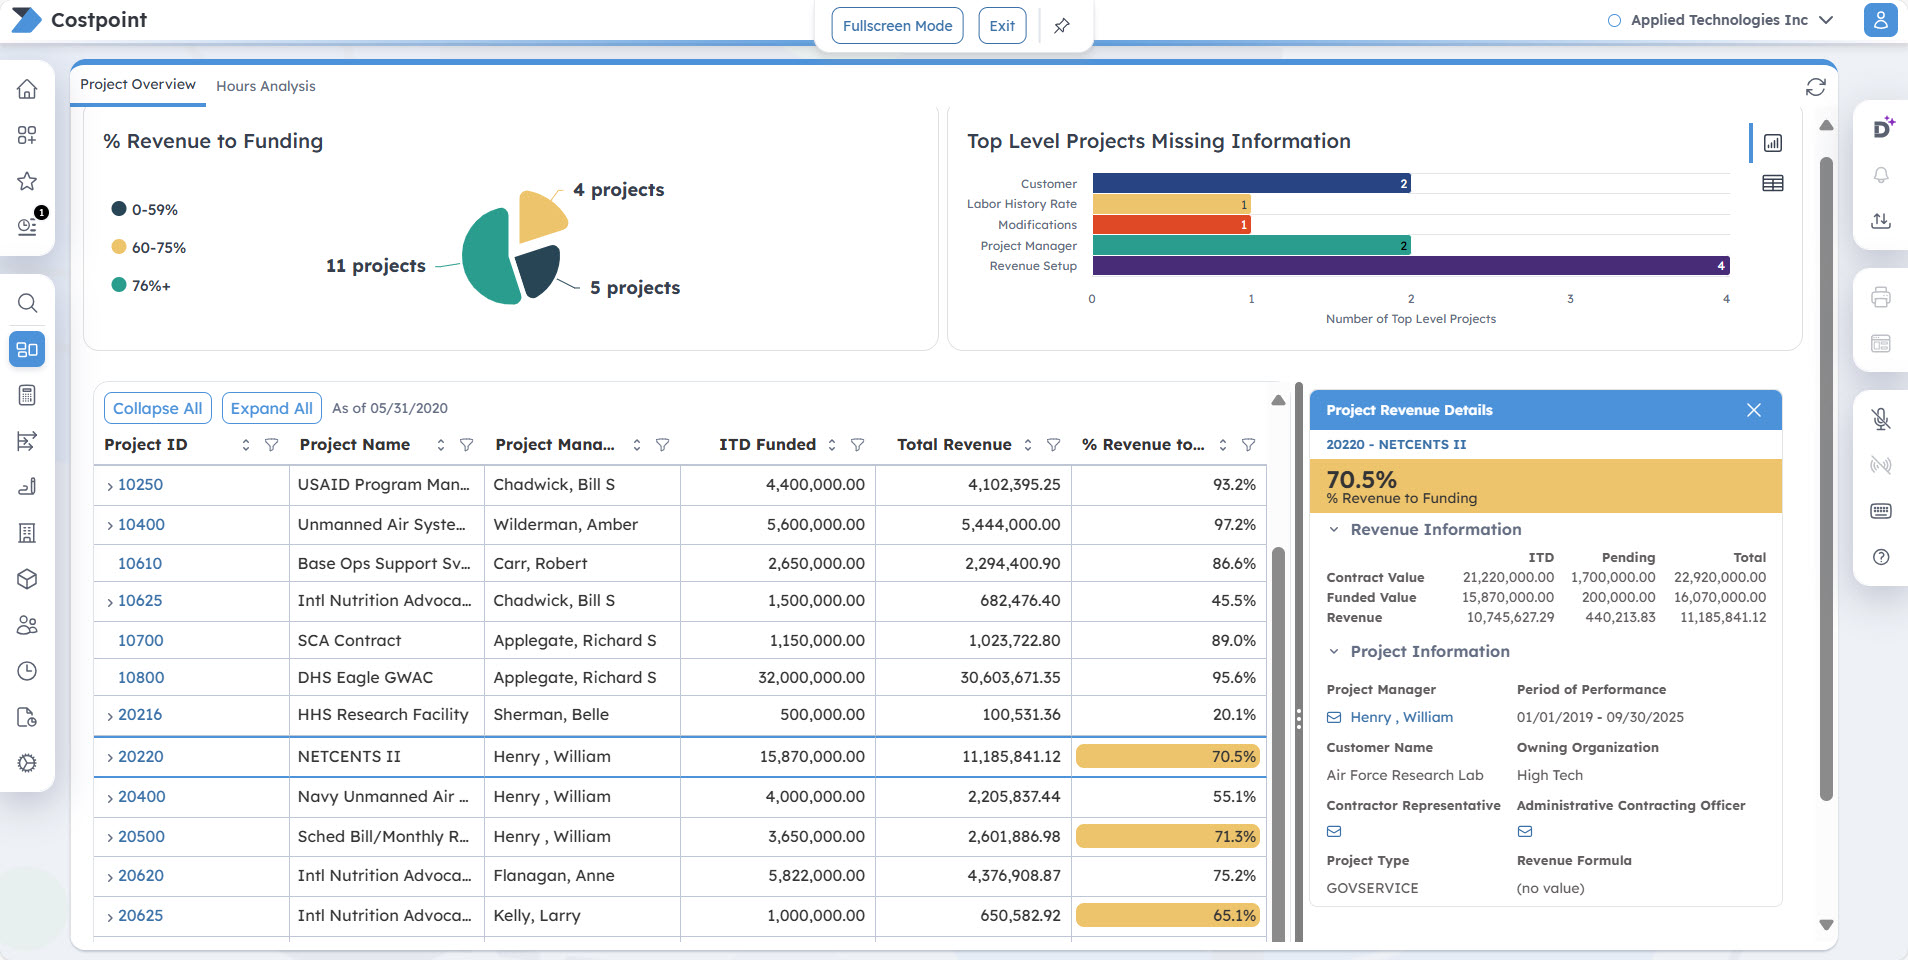
The Project Overview tab enables you to track project compliance and reporting, including revenue-to-funding value percentage.
It links to other Costpoint applications and shows specific project setup issues that may affect reporting accuracy. Click the info icon in the upper-right corner of any chart or table to see a quick explanation of what it shows and how to use it.
% Revenue to Funding
This pie chart provides a quick visual summary of the distribution of top-level projects based on the percentage of revenue earned compared to the funded value. Use this information to monitor project progress and notify customers when the project is approaching a 75% milestone.
The pie chart is categorized into the following ranges:
- 0-59%
- 60-75%
- 76%+
The number of top-level projects in each range is displayed next to the corresponding segment.
Top Level Projects Missing Information
This bar chart and table identify top-level projects with missing or incomplete setup data, which may affect reporting accuracy across Costpoint. Use the icons in the upper-right corner to switch between the bar chart and table views. The table view lists the specific projects with missing information.
The horizontal bar chart displays how many top-level projects are missing information in each category. For each missing type, the chart counts a project once if any required information is missing at lower levels, regardless of how many levels are affected. This ensures the chart provides a clear, high-level overview without overstating the issue.
For example, if Project Manager is missing on every project level, the chart counts it as 1 for the associated top-level project, not for each missing lower level. If the revenue level is undefined or missing, Command Center treats the setup as incomplete for the top-level project, rather than attempting to count missing items at lower levels. Similarly, Labor History Rate and Modifications are only counted when the revenue level is defined, since these are required at that level.
Clicking a bar filters the table to display only projects missing that specific data. From the filtered table, click Missing Type to open the relevant application and update the data. You must have rights/access to the application to be able to open it. The linked application varies by missing data type:
- ,
Manage Project Labor Categories (PLC), or
Link PLC Rates to Employee/Vendor
Note: The Missing Labor History Rate is a dynamic link that directs you to one of these three Costpoint applications, depending on the project's rate sequence setup.
Project Table
This table provides a detailed list of all top-level projects assigned to you and expands to revenue-level projects. It serves as the main data view for tracking project performance at a glance.
Use the following controls above the table to customize your view:
| Field | Description |
|---|---|
| Collapse All |
Click this button to collapse grid information. |
| Expand All |
Click this button to expand grid information. |
| Clear All Filters |
Click this button to clear all the filters you selected. |
| As of [date] |
The data displayed in this table is based on the End Date set on the Manage Current Reporting Period screen, which is maintained by your administrator. The active reporting date is displayed at the top of the table header (for example, As of 05/31/2020). |
The table includes the following columns:
| Field | Description |
|---|---|
| Project ID |
This column displays the project ID. You can click the arrow icon to drill down to the revenue-level project. This is a clickable link that opens the Manage Project User Flow application, where you can view and update detailed project information. |
| Project Name |
This column displays the project name. |
| Project Manager |
This column displays the project manager assigned to the project. |
| ITD Funded |
This column displays the inception-to-date (ITD) funded value, including award fee. |
| Total Revenue |
This column displays the total revenue, which includes ITD revenue calculated at target rates, plus pending revenue. Pending revenue is the estimated revenue on transactions like labor expenses that have been entered but not yet posted. It helps provide more real-time insight into the % Revenue to Funding calculation. |
| % Revenue to Funding |
This column displays the percentage of revenue compared to the funded value. Projects that are 60-75% are highlighted in yellow. |
Project Revenue Details
The Project Revenue Details side panel is displayed when you click any row in the project list table. It displays the selected project's revenue performance and key setup information.
| Field | Description |
|---|---|
| Project ID - Project Name |
This is a clickable link that opens the Project Status Report for the selected project on a new tab. When you hover over this field, a tooltip labeled "Launch Project Status Report" is displayed. Use the Export Report drop-down list in the upper-right corner of the Command Center screen to export the Project Status Report in HTML, PDF, Excel, Excel Data, CSV, or XML format. |
| % Revenue to Funding |
This displays the % Revenue to Funding value. Projects that are 60-75% are highlighted in yellow. |
Revenue Information
| Field | Description |
|---|---|
| Contract Value |
This displays the ITD, Pending, and Total contract values. Pending values represent future modifications or changes effective after the current BI reporting period, while ITD values are based on the effective date of the modification. These values are updated when revenue is calculated, and changes are stored in the PROJ_MOD_ITD_SUM table and then reflected in PSR_HSR. |
| Funded Value |
This displays the ITD, Pending, and Total funded values. Pending values represent future modifications or changes effective after the current BI reporting period, while ITD values are based on the effective date of the modification. These values are updated when revenue is calculated, and changes are stored in the PROJ_MOD_ITD_SUM table and then reflected in PSR_HSR. |
| Revenue |
This displays the ITD, Pending, and Total revenue values. Pending revenue is the estimated revenue from transactions that have been entered but not yet posted. It helps provide more real-time insight into the % Revenue to Funding calculation. Optionally, to populate the Pending Revenue column, run the Update Pending Report Tables application. Important: As a best practice, it is recommended to update pending transactions, PSR, revenue, and burdens daily. If you update the pending transactions daily but only update the PSR weekly, some transactions may not be displayed in either data set. Posted transactions will drop from the pending table but won't be displayed in the PSR until its next update. Make sure your process timing is aligned to avoid data gaps.
|
| Project Status Update |
This displays the most recent date and time when the PSR data was last refreshed. |
| Pending Report Update |
This displays the most recent date and time when the pending revenue data was last refreshed, based on the source table used for Pending Revenue. |
Project Information
| Field | Description |
|---|---|
| Project Manager |
This displays the project manager assigned to the project. Click the name to send an email to the project manager using your default email application. |
| Period of Performance |
This displays the period of performance dates. |
| Customer Name |
This displays the customer name that is entered on the Manage Project User Flow screen. |
| Owning Organization |
This displays the owning organization. |
| Contractor Representative |
Click the name to send an email to the contractor representative using your default email application. |
| Administrative Contracting Officer |
Click the name to send an email to the administrative contracting officer using your default email application. |
| Project Type |
This displays the project type. |
| Revenue Formula |
This displays the revenue formula. |