Manage tab
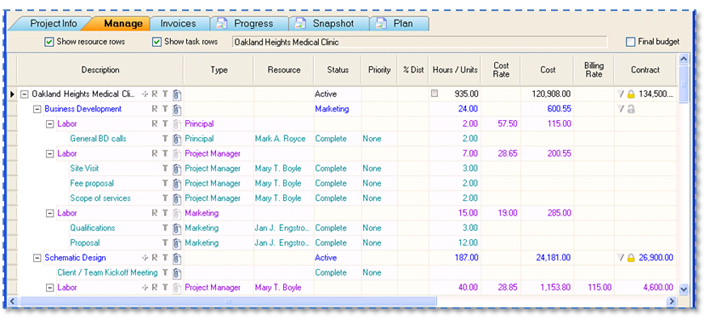
Use the Manage tab to produce a working budget and schedule for your project.
The Manage tab can display a Gantt chart of the start and end dates for the project, phases, and subphases. To view this chart, click the Show Gantt button at the bottom of the window.
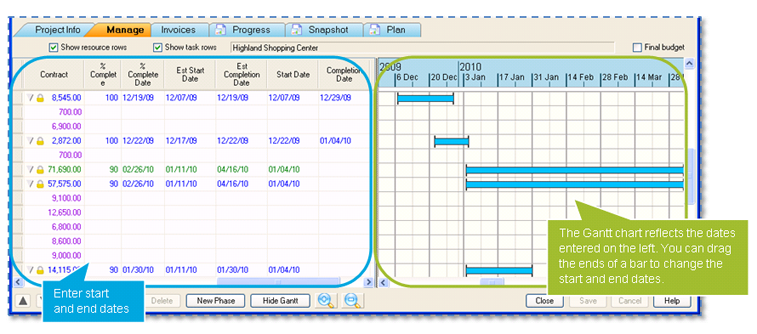
As you schedule the project on the Manage tab, you work with dates on the left. The Gantt chart on the right displays the dates graphically.
This Gantt chart is interactive - you can drag the ends of a horizontal bar in the chart and the start date and the end date columns on the left update accordingly. The Gantt chart always displays actual start and completion dates if available. Otherwise, it uses the estimated dates.
To hide the Gantt chart, click the Hide Gantt button at the bottom.
Later in this course, you will learn more about scheduling labor resources on the project using Schedule Manager.
Next