Lesson 1: Additional project reports
In this topic, you'll have the opportunity to take a look at some of the other reports in Ajera that can help you further track, monitor, and analyze your projects.
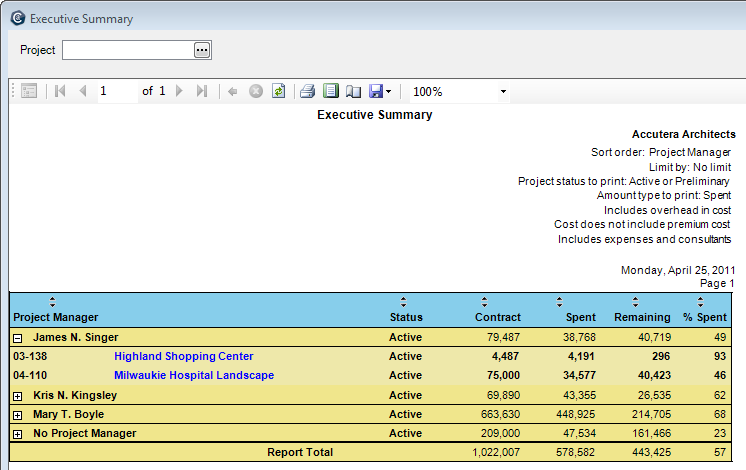
Executive Summary report
Use the Executive Summary report to:
- Obtain a summary view of your firm's projects at a glance.
- Evaluate how project managers are performing.
- See which clients or type of projects are your most profitable for determining which projects to pursue.
You can review the percent spent overall to determine potential problem projects and then drill down for more detail on each phase/task. This one-page report gives you all the information you need to quickly assess total company resources spent on your projects compared to what has been budgeted. If you need a list of projects by type for marketing that next big job, then this is the report for you!
You can summarize information by project manager, principal in charge, project type, or department. You can drill down to project and then phase information.
Where to see it
Click Reports > Project > Executive Summary.
What it looks like
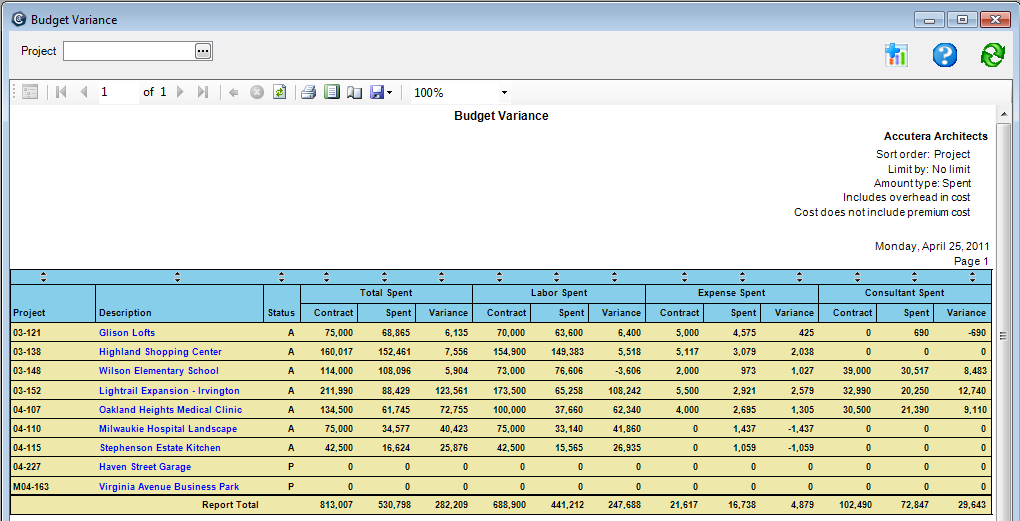
Budget Variance report
Use the Budget Variance report to monitor labor, expense, and consultant totals.
Use the graph view to see, at a glance, which projects need your attention. The comprehensive budget information on the report includes contract amount, amount spent, and amount remaining for labor, expenses, and consultants.
You can summarize information by project manager, principal in charge, project type, or department. You can drill down to project and phase information.
Where to see it
Click Reports > Project > Budget Variance.
What it looks like
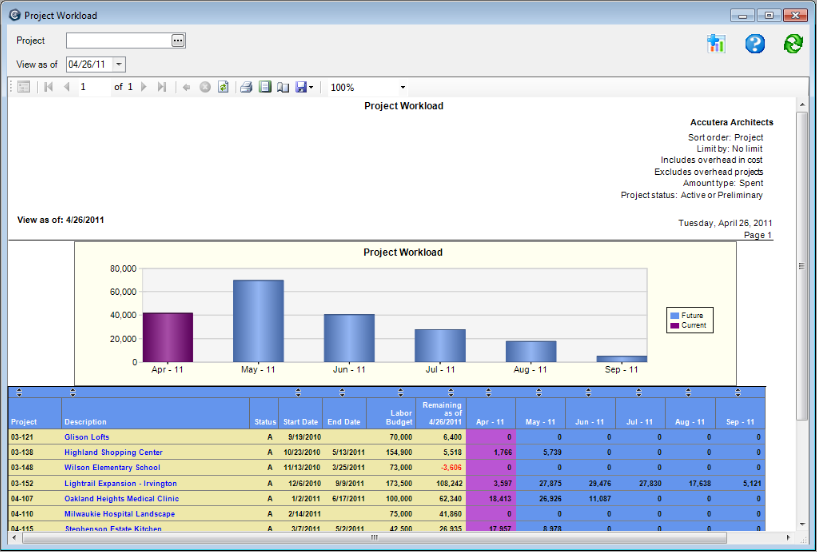
Project Workload report
Use the Project Workload report to forecast future requirements and view past trends, all in one report. The report displays contract remaining amounts for phases, and it forecasts when those amounts will be spent. It builds the forecasts using a straight-line estimate, and the start and end dates assigned to the phase. With this report, you can:
- Identify future revenue.
- See workload by company, department, or principal.
- Determine your ability to handle a new project according to the time frame requested by the client.
- Select to show the effect of your business development pipeline on future workload.
Where to see it
Click Reports > Project > Project Workload.
What it looks like
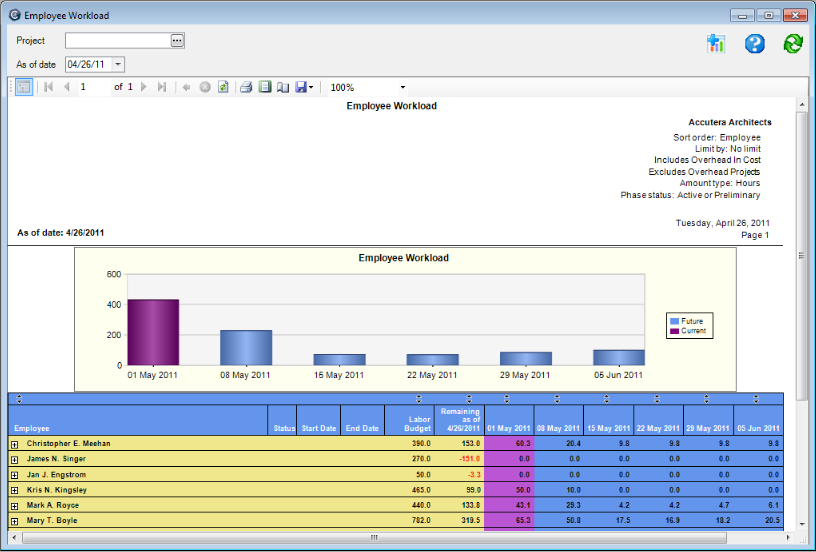
Employee Workload report
Use the Employee Workload report to determine your labor resource requirements. The report evaluates all employees assigned work at the project level and forecasts remaining amounts using a straight-line method for the phases. With this report, you can:
- Identify under- or overutilized resources.
- Forecast future staffing requirements.
- Identify workload by employee type, employee, or project.
- Create a master company work schedule.
Where to see it
Click Reports > Project > Employee Workload.
What it looks like
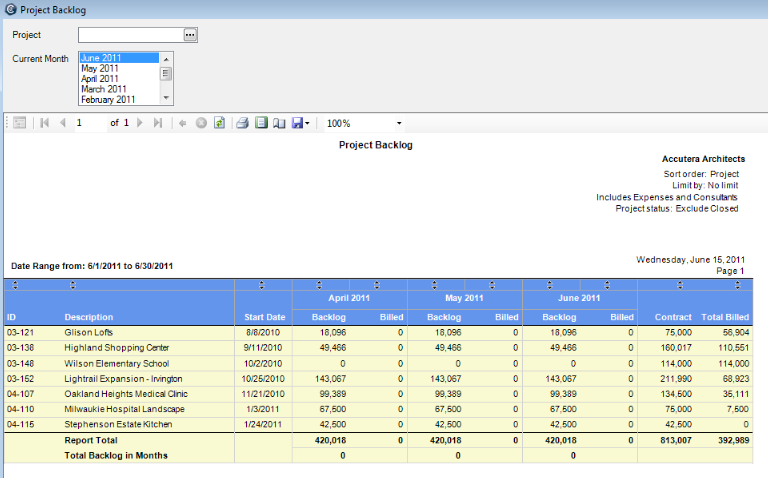
Project Backlog report
Use this report to predict the amount of work already contracted that has yet to be completed. This easy-to-read graphic output shows you the three-month trend of backlog and predicts how many months of work the firm has available to be completed. Watching the trend of backlog helps you know when to increase marketing efforts or to hire additional staff.
This report displays the backlog for the current month and previous two months. It includes only projects with an actual start date and contract amount.
Where to see it
Click Reports > Project > Project Backlog.
What it looks like
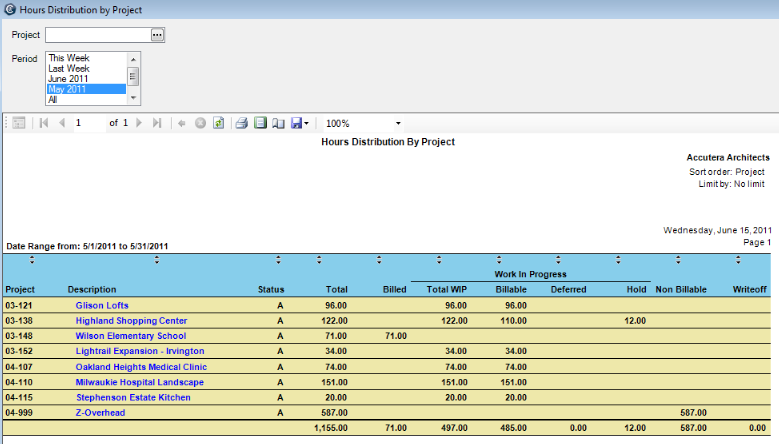
Hours Distribution by Project report
Use this report to review which employees are charging hours on your projects, how they are spending their time, and what hours are available to be billed.
This drill-down report starts at the project-total level, drills down to the phase totals, and then to the staff and specific dates that hours were charged. This report displays hours entered on timesheets for specific projects. It does not include beginning balance hours entered in the Project Command Center.
You can summarize information by project manager or principal in charge, and drill down to project, phase, and employee timesheet detail information.
Where to see it
Click Reports > Project > Hours Distribution by Project.
What it looks like
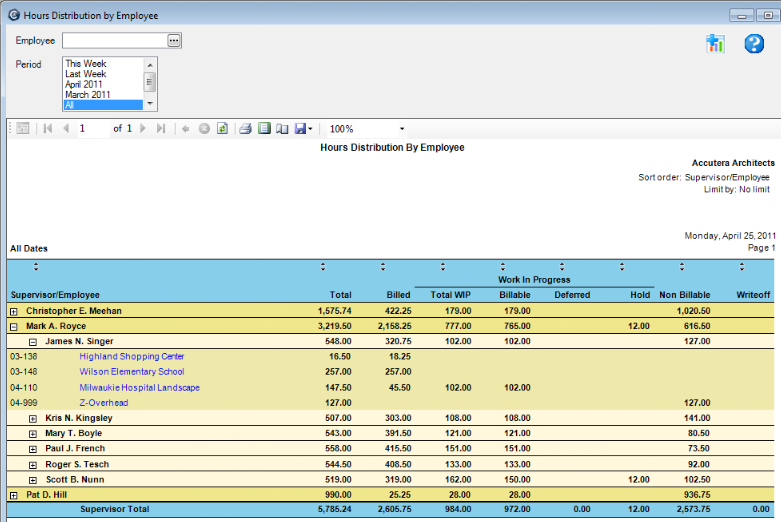
Hours Distribution by Employee report
Use this report to review employee time on projects and employee productivity.
This multipurpose report allows visibility to each supervisor’s employees and to details about the hours that they worked. You can start with a summary of total hours by supervisor and drill down to the specific details of an employee’s time spent. Define the period you want to report: this week, last week, the month, and so on.
This report shows all the hours entered on timesheets by employees.
You can summarize the information by supervisor or employee and drill down to employee time.
Where to see it
Click Reports > Employee > Hours Distribution by Employee.
What it looks like
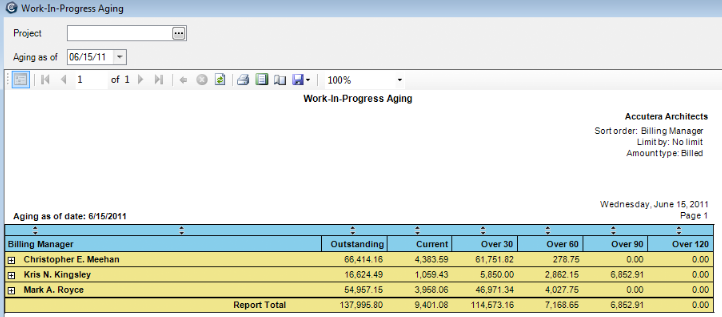
Work-in-Progress Aging report
Use this report to quickly identify projects with time and expenses that are not getting invoiced on a timely basis. You can see items that have not been billed so that you can initiate billing or write them off. This information is displayed in five aged columns, from Current to Over 120 days.
You can view work-in-progress (WIP) based on original or adjusted amounts. You can drill down to find the
specific detail of when the work was performed or the expense was incurred,
and by whom.
based on original or adjusted amounts. You can drill down to find the
specific detail of when the work was performed or the expense was incurred,
and by whom.
You can summarize information by billing manager, principal in charge, project type, or department, and drill down to project, phase, and full unbilled detail information.
Where to see it
Click Reports > Project > Work-In-Progress Aging.
What it looks like
Learn the details
These links go to help. To return to this course, click the Back button.
Hours Distribution by Project report
Hours Distribution by Employee report
Test your knowledge
Quiz: Additional Project Reports
Next