Financial Review Tab
Use the Financial Review tab to assess your company's financial performance and track revenue, expenses, and profit trends.
The data displayed on this dashboard is restricted based on the user's logged in Company ID and organizational security settings. Click the info icon in the upper-right corner of any chart or table to see a quick explanation of what it shows and how to use it.
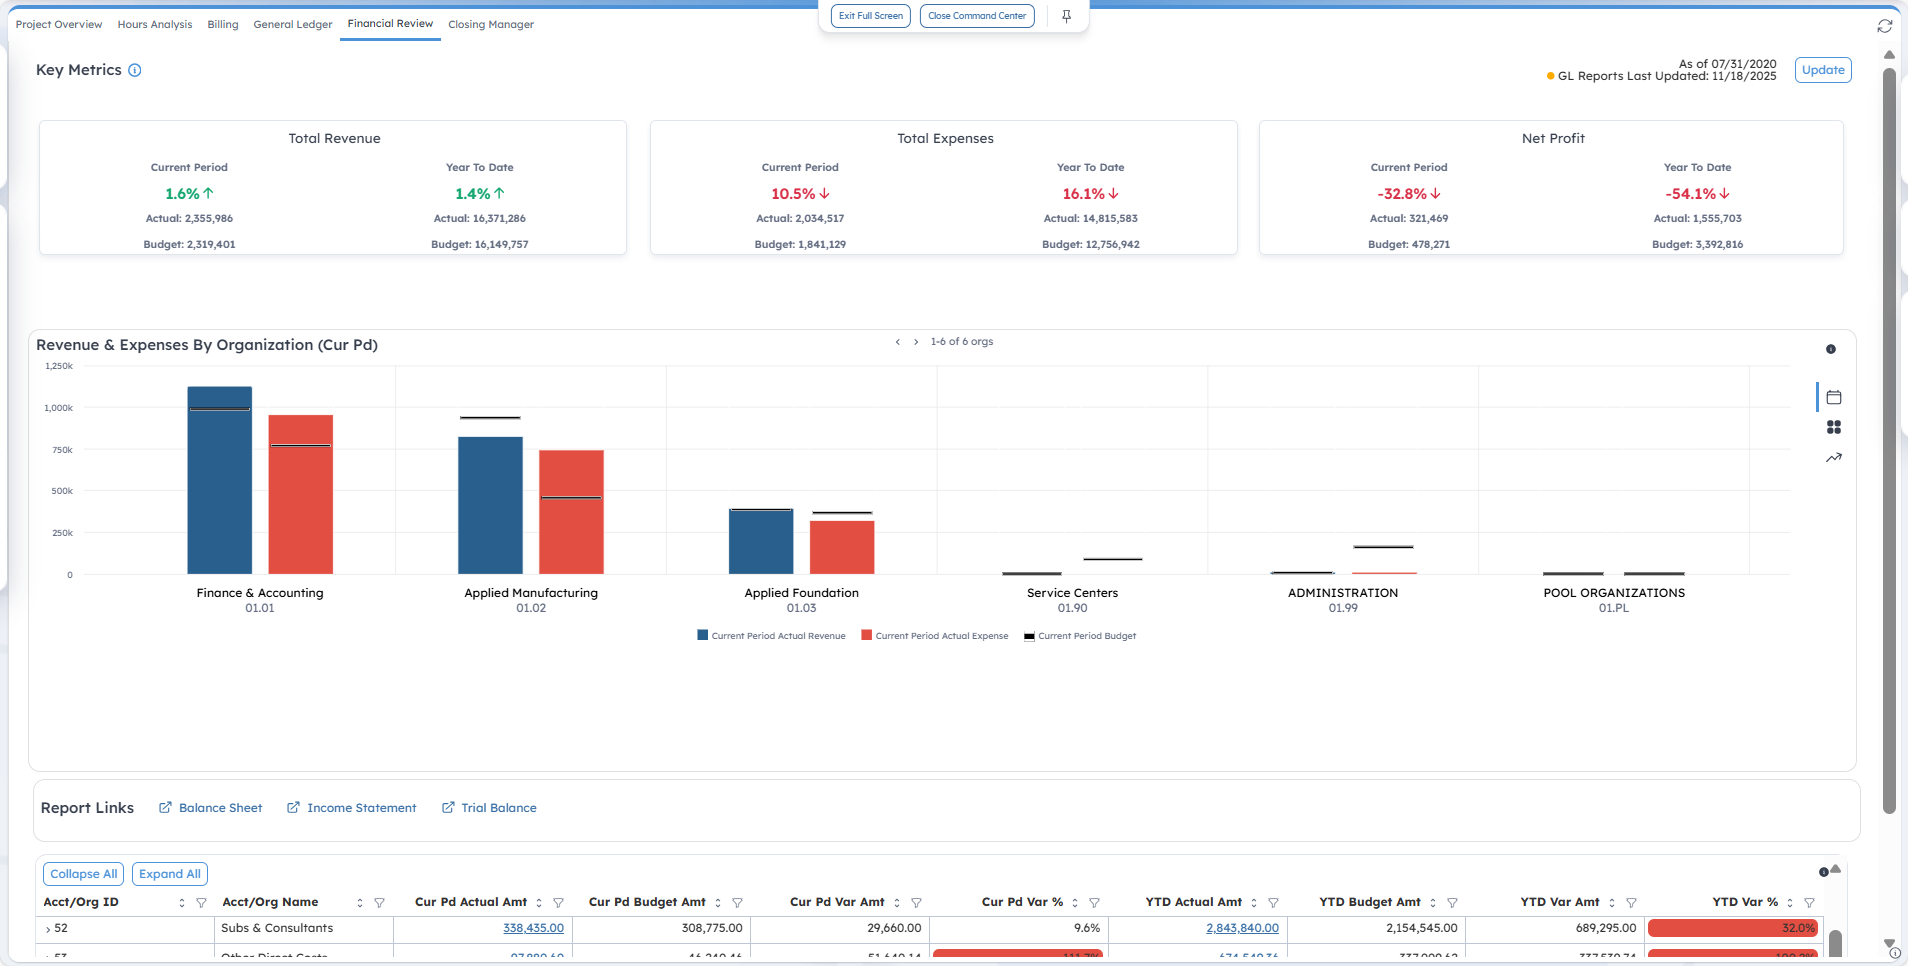
Key Metrics
This section provides insight into the actual and budgeted revenue, expenses, and profit for the current period and year-to-date (YTD). It also includes variance percentages that highlight favorable or unfavorable performance trends. The data is based on the company's primary income statement configuration.
| Field | Description |
|---|---|
| As of [date] |
The data displayed in this section is based on the End Date set on the Manage Current Reporting Period screen, which is maintained by your administrator. The active reporting date is displayed at the upper-right corner of the screen (for example, As of 05/31/2020). |
| GL Reports Last Updated | This displays the date of when the general ledger (GL) reporting table was last updated. |
| Update | Click Update to open the Create General Ledger Report Tables application and update the GL Report table, if needed. You must have been granted the appropriate rights to open this link. |
| Total Revenue |
This displays the actual versus budgeted total revenue for the current period and year-to-date. When the
Actual
revenue is greater than the
Budget revenue, it is a positive variance. Positive variance percentages are displayed in green with an upward arrow to indicate a favorable trend, while negative variance percentages are displayed in red with a downward arrow to indicate an unfavorable trend.
Note: Only lines with the
Revenue checkbox selected on the Manage Financial Statements screen are included in the
Total Revenue. This checkbox must be selected for any line that contains revenue account balances. It is not limited to lines outside the main Revenue financial statement, such as "other revenue."
|
| Total Expenses |
This displays the actual versus budgeted total expenses for the current period and year-to-date. Lines with the Revenue checkbox cleared on the Manage Financial Statements screen are included in the total expenses. When the Actual expense is greater than the Budget expense, it is a negative variance. Positive variance percentages are displayed in green with an upward arrow to indicate a favorable trend, while negative variance percentages are displayed in red with a downward arrow to indicate an unfavorable trend. |
| Net Profit |
This displays the actual versus budgeted net profit for the current period and year-to-date. When the Actual profit is greater than the Budget profit, it is a positive variance. Positive variance percentages are displayed in green with an upward arrow to indicate a favorable trend, while negative variance percentages are displayed in red with a downward arrow to indicate an unfavorable trend. |
Revenue & Expenses by Organization
This bar chart provides a comparative view of revenue and expenses for each second level of the organization. Click the icons on the right side of this section to switch among the three tabs:
- Revenue & Expenses by Organization (Cur Pd): This displays data for the current period.
- Revenue & Expenses by Organization (YTD): This displays data for the year-to-date.
- Revenue & Expenses by Organization (By Period): This displays trended view of revenue and expenses by period for the current fiscal year.
The blue bar represents the Actual Revenue, while the red bar represents the Actual Expense. A target line in each bar indicates the budgeted revenue or expense amount. When you hover over each bar, a tooltip displays with the Total Revenue or Total Expense, Target Budget, and Variance values.
Report Links
The Financial Review tab gives you quick access to financial reports in Costpoint BI. When you click on the following report links, the prompt page opens on a new tab within the Command Center, where you can set the prompts and generate the reports based on your default format preference. You can also use the Export Report drop-down list in the upper-right corner of the Command Center screen to export the reports in HTML, PDF, Excel, Excel Data, CSV, or XML format.
- Balance Sheet
- Income Statement
- Trial Balance
For improved usability, some fields on the prompt page are pre-propulated:
- Company: The default value is based on the user's logged in Company ID.
- Financial Statement Code: This field defaults to the Primary Balance Sheet or Primary Income Statement format.
- Fiscal Year: This is based on the BI Reporting Period.
- Period: This is based on BI Reporting Period.
Account Variance Grid
This table shows the financial performance by top-level account, with both Current Period and YTD actual, budget, and variance amounts. Use the following controls above the table to customize your view:
| Field | Description |
|---|---|
| Collapse All |
Click this button to collapse grid information. |
| Expand All |
Click this button to expand grid information. |
| Clear All Filters |
Click this button to clear all the filters you selected. |
The table includes the following columns:
| Field | Description |
|---|---|
| Acct/Org ID |
This column displays the account or organization ID. You can click the arrow icon to drill down to lower account levels and up to the second organization level. |
| Acct/Org Name |
This column displays the account or organization name. |
| Cur Pd Actual Amt |
This column displays the actual amount for the current period. It is a clickable link that opens the Account Detail Drill Thru report on a new tab within the Command Center. Use the Export Report drop-down list in the upper-right corner of the Command Center screen to export the Account Detail Drill Thru report in HTML, PDF, Excel, Excel Data, CSV, or XML format. The drill thru report has filters applied based on the following:
Note: If labor suppression is enabled for your user ID, the labor details will be hidden. In addition, GL transactions posted after the most recent update to the GL reporting tables are included in the drill thru report but may not be included in the Account Variance grid. Transactions are flagged as timing differences if the timestamp is after the last GL update.
|
| Cur Pd Budget Amt |
This column displays the budget amount for the current period. |
| Cur Pd Var Amt |
This column displays the variance amount for the current period. |
| Cur Pd Var % |
This column displays the variance percentage for the current period. Variance percentages are categorized and color-coded into the following:
|
| YTD Actual Amt |
This column displays the actual amount for the year-to-date. It is a clickable link that opens the Account Detail Drill Thru report on a new tab within the Command Center. Use the Export Report drop-down list in the upper-right corner of the Command Center screen to export the Account Detail Drill Thru report in HTML, PDF, Excel, Excel Data, CSV, or XML format. The drill thru report has filters applied based on the following:
Note: If labor suppression is enabled for your user ID, the labor details will be hidden. In addition, GL transactions posted after the most recent update to the GL reporting tables are included in the drill thru report but may not be included in the Account Variance grid. Transactions are flagged as timing differences if the timestamp is after the last GL update.
|
| YTD Budget Amt |
This column displays the budget amount for the year-to-date. |
| YTD Var Amt |
This column displays variance amount for the year-to-date. |
| YTD Var % |
This column displays the variance percentage for the year-to-date. Variance percentages are categorized and color-coded into the following:
|