To access a cumulative profit and loss chart, complete the following:
Select the Cost Analysis module.
Select Organization as the in management context.
Navigate to the lowest level of the Org./OBS structure in the organization navigation field.
In Reports & Actions, select C.O.P.5 Profit and Loss Chart (Cum).
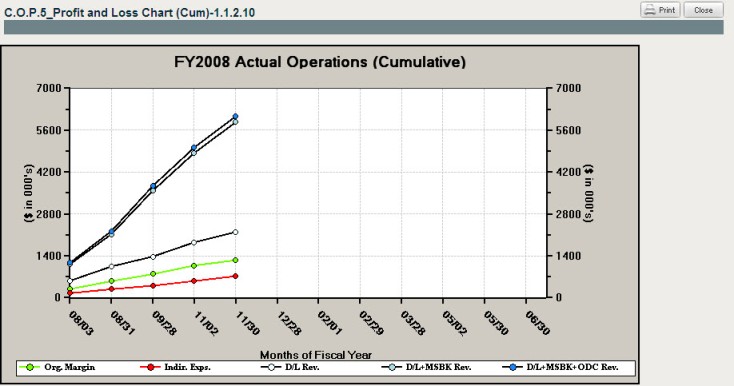
Click to open the chart to see actual P&L revenue. The chart shows Original Margin (green), Indirect Expenses (red), Direct Labor Revenue (white), Direct Labor + Material/Subcontractors Revenue (light blue) and Direct Labor + Material/Subcontractors + Other Direct Costs Revenue (darker blue).