Drill Down to More Detailed Data on Performance Dashboards
For many charts and tables on performance dashboards, you can drill down from higher level data to more detailed data.
To drill down to more detailed data, complete the following steps:
-
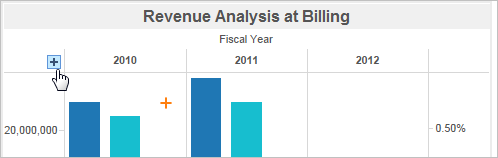
To display the Drill Down icon, position the mouse pointer in the heading information for the dimension from which you want to drill down.
-
Click
 .
.
-
To reverse the drill down and again display data at a higher level, position the mouse pointer in the heading information for the original level to display
 , and click that icon.
Note: If you select one or more dimension values on the chart and hover over one of the selections, the Drill Down or Drill Up icon is also available in the tooltip that displays.