Display Numeric Data Values for a Performance Dashboard Chart
You can display the specific numeric values for an individual data mark or a group of selected data marks on a chart. If you drill down on a chart, you can display numeric values either for data marks or for dimensions at higher levels of the drill-down hierarchy.
To display specific numeric values represented on a chart, complete the following step:
-
Do any of the following:
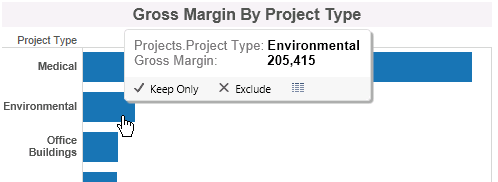
- To display numeric values for an individual data mark, hover the mouse pointer over the data mark.
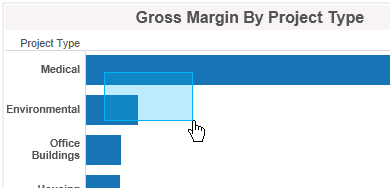
- To display the sum of measure values for a group of data marks, press and hold
CTRL as you click each of the marks, and hover the mouse pointer over one of the selected data marks. If the data marks are located together, you can also click and drag the mouse pointer so that the selection area includes or touches each of the data marks.
- To display the sum of measure values for one dimension value at a summary level, click that dimension value and hover the mouse pointer over the selected area.
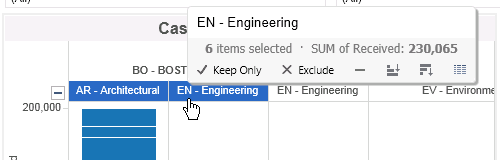
- To display the sum of measure values for multiple dimension values at a summary level, press and hold
CTRL as you click each of the dimension values and hover the mouse pointer over one of the selected areas.
- To display numeric values for an individual data mark, hover the mouse pointer over the data mark.
-
If you displayed the sum of multiple measure values and want to display the individual values included in the sum, click the View Data icon (
 ) in the tooltip.
Result: The individual values display on a separate View Data page.
Note: If you want to work with the data from the View Data page in another application, click Download all rows as a text file on the View Data page to create a comma-separated values (.CSV) file.
) in the tooltip.
Result: The individual values display on a separate View Data page.
Note: If you want to work with the data from the View Data page in another application, click Download all rows as a text file on the View Data page to create a comma-separated values (.CSV) file.