Display More or Fewer Columns in the Schedule Grid
You can change the schedule grid to display more or fewer columns.
To display more or fewer columns in the schedule grid, complete the following steps:
-
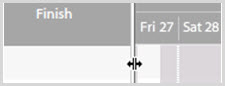
Hover over the line to the left of the first schedule date column in the Gantt chart.
The cursor changes to a
 as shown in the following figure.
- Click and drag left or right to display more or fewer columns.