
-
Right-click anywhere in the chart or table.
-
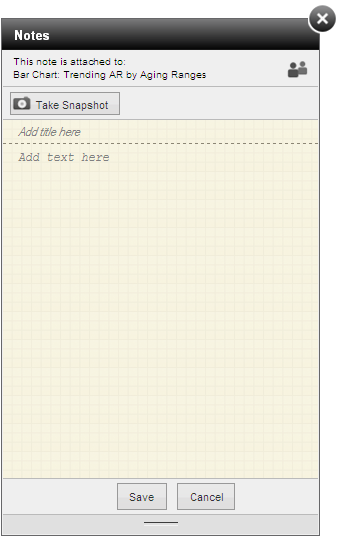
Click Note » Add a New Note on the shortcut menu to open the Notes dialog box.
-
Click Add title here to enter a title or heading for the note.
-
Click Add text here and enter the note.
-
If you want to attach a snapshot of the analytics to the note so you or others can see the full context for your note, click Take Snapshot.
-
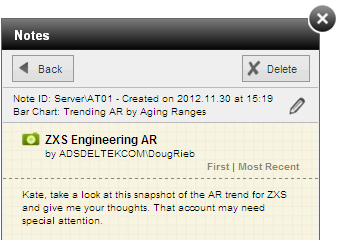
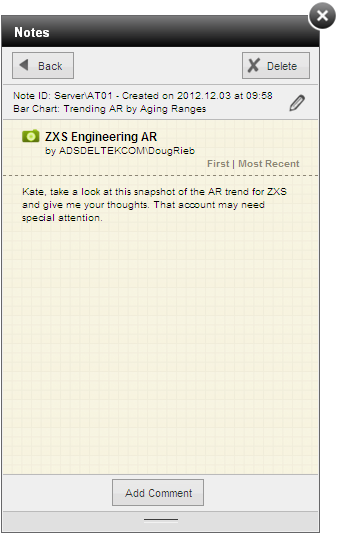
Click Save.
Note: Because there is no equivalent to the right-click on an iPad, iPad users cannot display the shortcut menus for charts or tables, or for lists that do not have the Menu icon (![]() ). As a result, they cannot attach notes directly to those objects.
). As a result, they cannot attach notes directly to those objects.
However, iPad users can still attach notes and snapshots related to the analytics to lists that have the Menu icon (![]() ) in the upper-right corner. Tap that icon to open the Notes dialog box.
) in the upper-right corner. Tap that icon to open the Notes dialog box.


