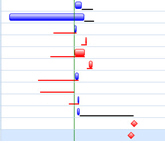
This tab includes date mode options and progress and float options for the top SmartGantt bar.
Dates
| Field | Description |
|---|
| Scheduled Dates
|
Current dates for the activities as defined in the schedule.
|
| Early Dates
|
Earliest possible date that the activity can start.
|
| Late Dates
|
Latest possible date that the activity can start.
|
| Baseline Dates
|
Dates defined by the project baseline.
|
| Original Dates
|
Dates as defined in the schedule prior to any modifications such as acceleration.
|
| Px Dates
|
Probabilistic or risk-adjusted dates identified during a project risk analysis.
|
Progress & Float
| Field | Description |
|---|
| Display Progress Bar
|
Select this option to show progress of each activity. A dark line will be added to the activity bar to display activity progress. For example, an activity with 50% completion looks like this:

|
| Display Float Bar
|
Select this option to display the amount of float on each activity. A black line is added below the activity to indicate positive float. A red line below the activity shows negative float.

|