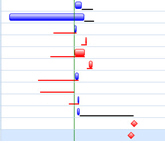
This tab includes date mode options and progress and float options for the bottom SmartGantt bar. It also includes an option to enable the bottom bar which must be selected in order to use the options on this tab.
Configuration
| Field | Description |
|---|
| Enable Bottom Bar
|
Select this option to enable the bottom bar in the SmartGantt chart.
|
Dates
| Field | Description |
|---|
| Scheduled Dates
|
Current dates for the activities as defined in the schedule.
|
| Early Dates
|
Earliest possible date that the activity can start.
|
| Late Dates
|
Latest possible date that the activity can start.
|
| Baseline Dates
|
Dates defined by the project baseline.
|
| Original Dates
|
Dates as defined in the schedule prior to any modifications such as acceleration.
|
| Px Dates
|
Probabilistic or risk-adjusted dates identified during a project risk analysis.
|
Progress & Float
| Field | Description |
|---|
| Display Progress Bar
|
Select this option to show progress of each activity. A dark line will be added to the activity bar to display activity progress. For example, an activity with 50% completion looks like this:

|
| Display Float Bar
|
Select this option to display the amount of float on each activity. A black line is added below the activity to indicate positive float. A red line below the activity shows negative float.

|


