|
The Labor Utilization summary analytics include the following:
You can choose to view available or direct labor utilization, and you can base the labor utilization calculation on either cost or hours. If your review of the summary labor utilization data suggests the need for more detailed analysis, click Labor Utilization to go to the Labor Utilization tab in Costpoint Analytics - Employees. If you have not been given access to labor utilization information in Costpoint Analytics, the Summary Dashboard tab does not display the Labor Utilization summary area. |
In this topicUser Options That Affect the Labor Utilization Summary
|
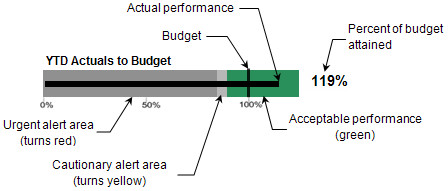
The Labor Utilization analytic area includes a bullet graph to give you a visual comparison of labor utilization to budget for the analysis period. The second column of the table below the bullet graph in the Labor Utilization summary area displays the labor utilization and budget rates on which the graph is based.
|
Graph Item |
Description |
|
Horizontal bar (black) |
The black horizontal bar represents the labor utilization rate for the analysis period (for example, year-to-date labor utilization). If you position the mouse pointer at any point on this bar, Costpoint Analytics displays the labor utilization budget rate, the labor utilization and percentage of budget at which the cautionary alert is triggered, and the labor utilization and percentage of budget at which the urgent alert is triggered. |
|
Vertical bar (black) |
The black vertical bar represents the labor utilization budget or forecast for the analysis period (for example, year-to-date labor utilization budget). |
|
Percent Attained |
The percentage to the right of the graph is the percentage of budget attained for the analysis period: (Labor utilization rate / Budget or forecast or target rate) × 100. |
|
Percentage scale |
The scale along the bottom of the graph indicates percentage of budget. |
|
Alert areas |
The graph background is divided into alert areas based on the under-utilization tolerance percentages that your system administrator established for labor utilization:
|
|
Data Item |
Description |
|
Available/Direct Cost/Hours Util %: Prior Year |
Year-to-date, quarter-to-date, or period labor utilization rate as of the current period in the prior year. |
|
Baseline Budget/Forecast/Target: Prior Year |
Year-to-date, quarter-to-date, or period budgeted or target labor utilization rate as of the current period in the prior year. |
|
Available/Direct Cost/Hours Util %: YTD/QTD/Period |
Year-to-date, quarter-to-date, or period labor utilization rate as of the current period in the current year. |
|
Baseline Budget/Forecast/Target: YTD/QTD/Period |
Year-to-date, quarter-to-date, or period budgeted or target labor utilization rate as of the current period in the current year. |
|
Variance: YTD/QTD/Period |
Year-to-date, quarter-to-date, or period labor utilization variance from budget, forecast, or target rate. If the percentage attained falls within the under-utilization cautionary alert range or urgent alert range, Costpoint Analytics displays the variance within a colored border to draw your attention to it. A yellow border indicates a cautionary alert, and a red border indicates an urgent alert. |
Summary labor utilization is calculated for regular, active employees only. You have the option to display either direct or available utilization. You also have the option to base the calculation of labor utilization on labor costs or on labor hours:
Direct labor utilization (cost) = Direct labor cost / Total labor cost
Direct labor utilization (hours) = Direct labor hours / Total labor hours
Available labor utilization (cost) = Direct labor cost / (Total labor cost – Leave cost)
Available labor utilization (hours) = Direct labor hours / (Total labor hours – Leave hours)
Budget and forecast labor utilization rates are calculated in the same way using labor cost and hours budget data loaded from the Labor Utilization Budget file.
A number of Costpoint Analytics configuration settings determine the labor costs and hours included in the calculation of labor utilization. For more on labor utilization calculation, see Labor Utilization: Data Sources.
Your system administrator uses a configuration setting to indicate whether budget labor utilization rates, target labor utilization rates, or both are available for comparison to the actual labor utilization rates in the detailed Labor Utilization Analytics.
The Summary Dashboard tab uses budget rates (baseline budget or forecast) in all cases except when the target rates option is the only option selected in Costpoint Analytics configuration. In that case, employee target rates are used.
Your selections on the User Options tab affect the labor utilization summary in the following ways:
|
User Option |
Effect on the Analytics |
|
Budget Type |
Use the options under Budget Type to specify the budget data to which you want to compare actual performance:
|
|
Org or Reorg |
Use the options under Org or Reorg to indicate if you want to view data based on the organization structure or based on a reorganization:
|