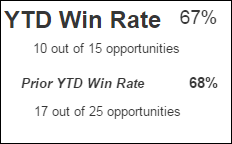
YTD Win Rate Summary
The YTD win rate summary displays the win rate for the current year through today's date, based on either the number of opportunities for which your firm won a contract or the total estimated revenue for those won opportunities. For comparison, it also provides the win rate as of the same date in the prior year.
Your selection of Amount or Count in Select Bid and Win Rates Based On determines whether the rates are based on number of opportunities or estimated revenue.
- Total estimated revenue for the won opportunities and total estimated revenue for won and lost opportunities, for the current year and prior year
- Total number of won opportunities and total number of won and lost opportunities, for the current year and prior year.
Win Rate Calculation
- Number of won opportunities / (Number of won opportunities + Number of lost opportunities)
- Total estimated revenue for won opportunities / (Total estimated revenue for won opportunities + Total estimated revenue for lost opportunities)
Revenue Amounts
Estimated revenue amounts used to calculate win rates are always unweighted. The win rate information is not affected by the options under Pipeline Probability Weighting.
Opportunities Included in Win Rate Calculation
Win rate calculation for the current year is based on the opportunities won and lost in that year. The win rate for the prior year is based on the opportunities won and lost from January 1 through today's date in the prior year.
Opportunity records can contain multiple date fields; your system administrator specifies the date field that is used, either when configuring Capture Analytics or, if your firm does not use Capture Analytics, when he or she sets up the data import process. For example, if your system administrator selects the award date, won and lost opportunities with an award date in the current year are included in the YTD win rate calculation for the current year.
If your firm uses Capture Analytics, which opportunities are counted as won opportunities and lost opportunities can be based on stage assignments, on values in other data fields, or on a combination of stage and another field value. Your system administrator specifies how to determine won and lost opportunities when configuring Capture Analytics. If your firm does not use Capture Analytics, whether an opportunity is a won or lost opportunity is based on stage assignment only. Your system administrator specifies the stages to which won and lost opportunities are assigned when he or she sets up the data import process.
Filter Options
- Opportunities that are associated with a specific company (if your firm has multiple companies in Costpoint).
- Opportunities that are associated with one or more specific organization codes. Use the
 icon at the top of the
Org filter list to display organization codes for all levels of the organization structure or only the organization codes for a specific level. (If
~No Value~ displays in the
Org list, it indicates that one or more opportunities are not assigned to an organization. You can select
~No Value~ to focus the summary on those opportunities.)
icon at the top of the
Org filter list to display organization codes for all levels of the organization structure or only the organization codes for a specific level. (If
~No Value~ displays in the
Org list, it indicates that one or more opportunities are not assigned to an organization. You can select
~No Value~ to focus the summary on those opportunities.)
- Opportunities that are associated with selected clients.
- Specific types of opportunities.
The Probability > filter option does not apply to win rate information.