Risk Driver Comparison
The Risk Driver Comparison chart displays several cost / schedule risk driver result sets on the same chart. Each result set is summed either by activity or by risk.
You can use the Risk Driver Comparison Activities or Risk Events commands to select how the result sets are summed.
The chart displays duration in days by default; however, you can display duration in hours and vice versa by changing the display settings on the S1 // Projects tab.
Risk Driver Comparison Grid
| Field Name | Description |
|---|---|
| Visible | Use this column to select the result sets that display on the chart. This allows you to have several result sets listed but only display a subset on the chart. |
| Sort | Click the sort radio button to sort by impact. Click it again to deselect it. If no button is selected then the graph is sorted by activity name or risk name. |
| Color | The colors in the Risk Driver Comparison chart are selected by the system when the chart is generated. Click in this cell to display the color palette and select an alternate color. |
| Name | Click in this cell to edit or rename the result set. |
| Remove | Click to remove a result set from the chart. If you remove a result set and wish to add it back, you will need to run Risk Analysis again and add it again. |
Example of a Risk Driver Comparison Chart
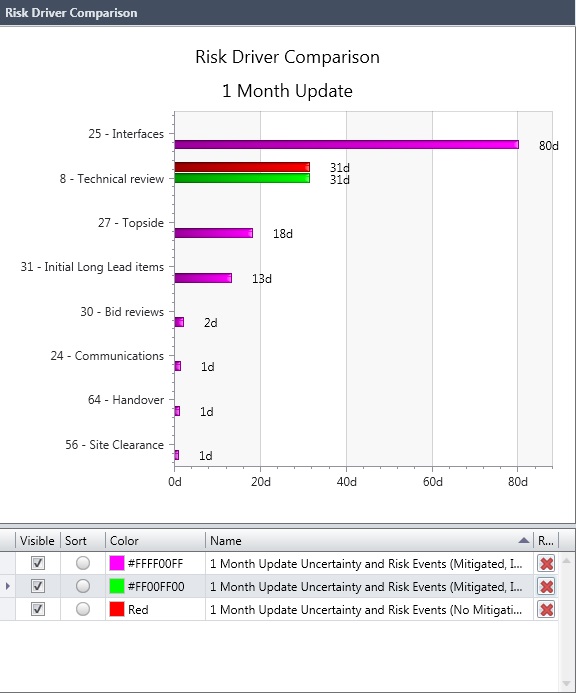
The Risk Driver Comparison chart displays duration in days by default; however, you can display the duration in hours and vice versa by changing the display settings on the S1 // Projects tab ().