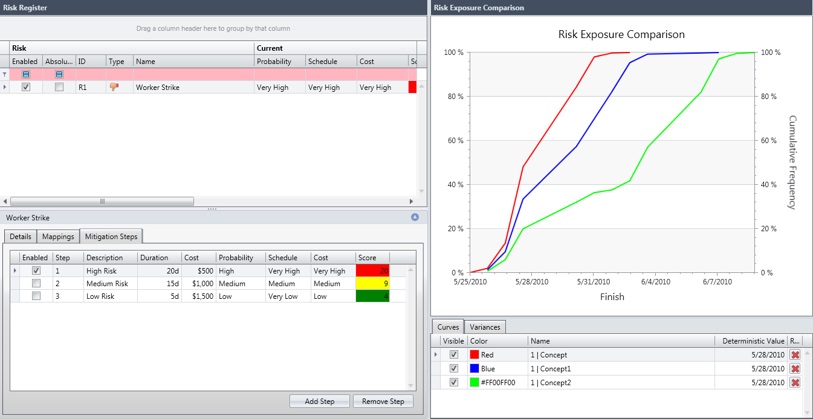
View a Risk Exposure Comparison Chart
This chart compares multiple risk exposure scenarios.
To view a Risk Exposure Comparison chart, complete the following steps:
-
On the S3 // Risk tab, in the Views group, click
.
From within the Risk Exposure Comparison Chart, you can rename and annotate scenarios by clicking on a given P or Confidence level within the chart itself. Variances are shown in the table beneath the chart.