Critical Schedule Drivers
When you run risk analysis and include uncertainties and risk events, each simulation may have a different critical path.
Activities that are critical in your deterministic schedule may not be the same as those identified in the statistical model.
Instead of looking at the critical path on the activity level, you can run simulations on the entire project. Each time a simulation is run, Acumen notes the critical path. As you run more and more simulations, some of the paths get repeated and those most common critical paths are the ones you may want to see.
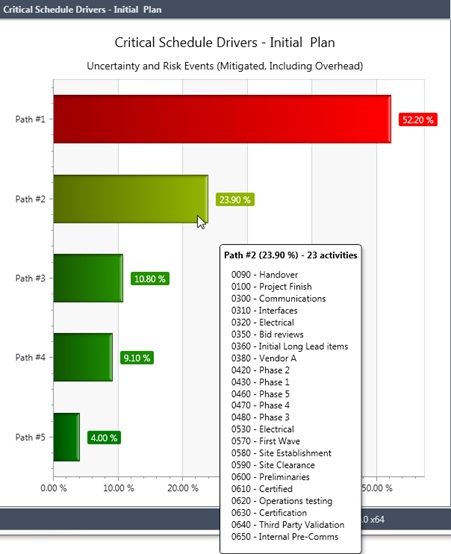
Acumen uses a Critical Schedule Driver tornado chart to display the most common critical paths. The percentage that displays to the right of each bar is how often, as a percentage, the path is most critical. For example, if you run 200 iterations and the Path 1 bar displays a percentage of 13%, it means that Path 1 was the critical path in 26 (13%) of the 200 iterations.
If you hover over a bar, you can see the list of activities that make up that path. You can create a SmartGantt filter using this information and use it to view the activities and make any needed adjustments.
Example of a Critical Schedule Driver Tornado Chart