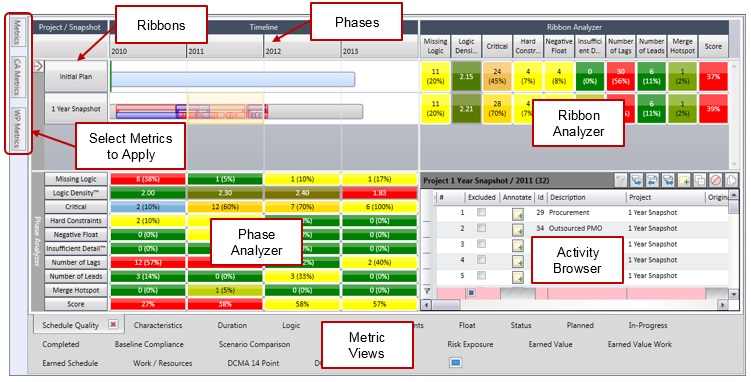
This tab includes ribbons and phases, an activity browser, and ribbon and phase analyzers.
You can use your mouse to hover over a metric and view the metric description in the tool tip. You can edit or add to these descriptions using the metrics
Description
field on the Metrics tab.

| Field | Description |
|---|
| Ribbons
|
Ribbons are groupings of activities based on a given criteria.
|
| Phases
|
Phases are user-definable 'segments' of time against which an Acumen Fuse analysis is run.
|
| Ribbon Analyzer
|
The ribbon analyzer shows the results from an analysis for each ribbon.
|
| Phase Analyzer
|
The phase analyzer shows the results from an Acumen Fuse analysis for each phase.
|
| Activity Browser
|
The Activity Browser lists specific activities based on a given criteria.
|
| Metric Views
|
By default, this tab is automatically populated with multiple sub-tabs containing separate views for each of the metric libraries. You can edit each of these views with regards to adding/removing metrics to each of the three analyzers (ribbon, phase, intersection).
|
| Select Metrics to Apply
|
Use these tabs to add metrics to one or more of the analyzers. You can edit, add, or remove metrics on the Metrics tab.
|

