Dashboard
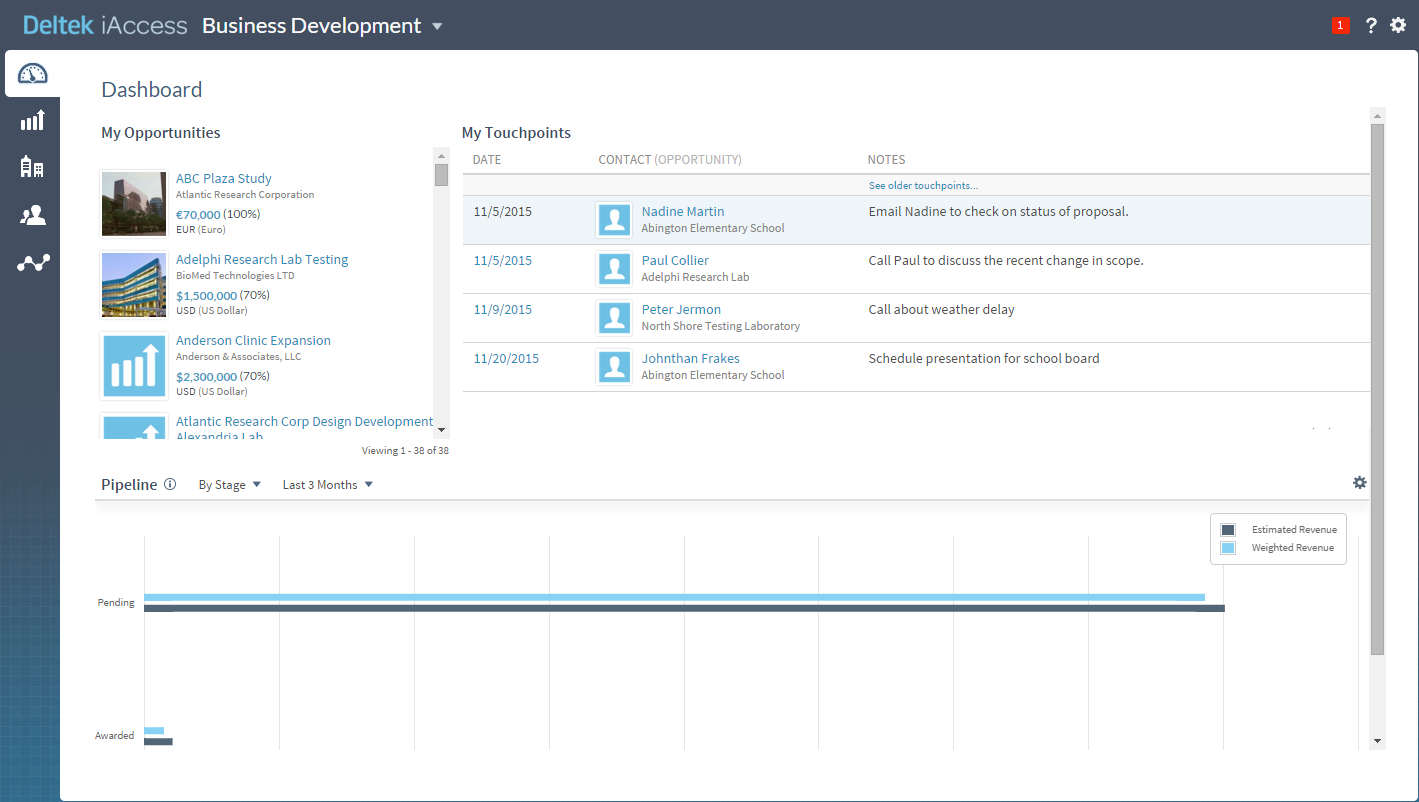
The Dashboard area of Business Development provides a list of the opportunities for which you are a team member, a list of your upcoming or historical touchpoints, and a Pipeline bar chart that displays estimated and weighted revenue for a set of opportunities that you select. You can break down the revenue on the chart based on any of a number of opportunity dimensions (for example, by client, by market, or by stage).
Your access to the Opportunities area determines your access to the Dashboard area. If you do not have access to the Opportunities area, you also do not have access to the Dashboard area.
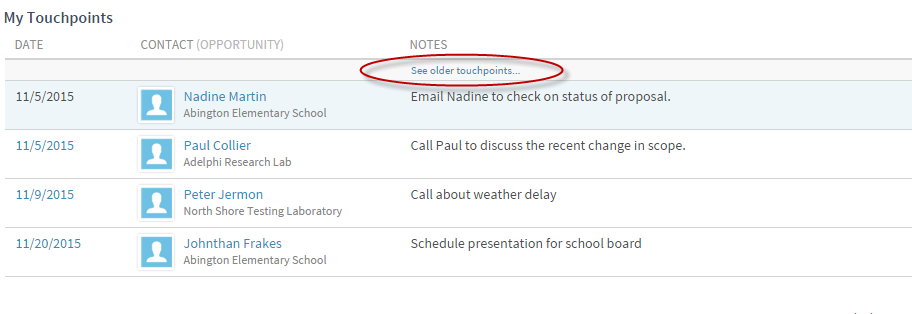
View Historical Touchpoints
The My Touchpoints grid displays your upcoming touchpoints and other activities, with the one scheduled soonest at the top. To view past touchpoints and other activities, click See older touchpoints at the top of the grid.
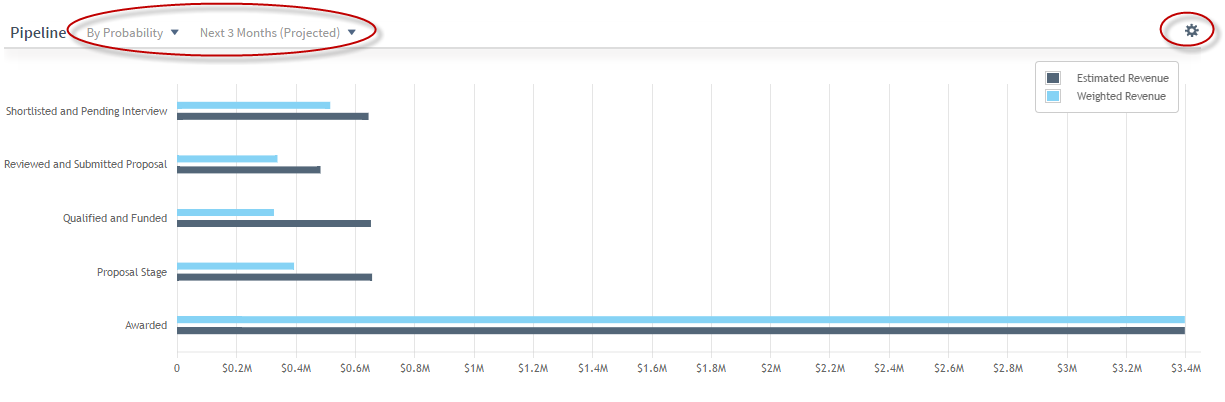
Control Your View of Pipeline Data
Use the controls above the Pipeline chart to select the dimension by which you analyze the pipeline revenue, the time frame for the revenue amounts, and the opportunities that are included.