Create Reports with Data Explorer
When you use Data Explorer to create reports you don't need a robust understanding of SQL. Navigate the relationships between our data tables, and search and use data objects on reports using a simple, intuitive interface. Each data object is presented in a way that clearly shows its relationship to joined data.
You must first enable the Data Explorer feature before you can perform these steps.
To create a report using Data Explorer:
- Expand the Reporting menu and click Explore My Data. Your data choices display in a tree format, to make it easy to distinguish the parent-child relationship between tables and fields.
-
Do one of the following to select tables, data objects, and fields:
- Browse:
Click on an item in the Your Data tree. This tree contains all Talent Management data objects and tables accessible to your role.
- Suggested Favorites: A list of commonly used tables and fields, organized by module, to get started creating your report.
- Advanced: Links to additional data, including
Most Referenced Objects,
Custom Data Objects,
Standard Data Objects, and
All Tables.
- Most Referenced Objects: Contains data from 50 of the most popular tables, organized by module. The term popular here indicates how many other tables link to a given table's primary key. For example, the primary key, Candidate ID, is referenced in many other Talent Management tables, which indicates the Candidate object is high in popularity.
- Custom Data Objects: Objects created by you, as well as objects made public by other creators.
- Standard Data Objects: Custom data objects used to build Talent Management standard reports. These are not created by users, and cannot be edited. They are accessible if enabled (Administration » Settings » Report Creation » Enable Standard Data Objects). Note that this enables all standard data objects for all Reporting Tool users.
- All Tables: This is a list of every MySQL table imported from Talent Management, all in one place.
- Search:Use the Search field at the top of the screen to search for fields, tables, and data objects. Enter at least three characters of a name or keyword for which to search. Results are returned as soon as you stop typing, and will recalculate if you continue typing. Search results will include data objects and tables, as well as fields. For Data objects and tables, click on an item to explore or browse the content for possible inclusion on your report. For fields, click the field to expand the Field Actions, then click Add this field to my report to add the field to the Report pane at the bottom of the screen. Continue to step 4.
- Browse:
Click on an item in the Your Data tree. This tree contains all Talent Management data objects and tables accessible to your role.
-
Click the arrow to expand one of the following areas to find the items you want to add to your report.
Note: It may help to consider how the item you are searching for relates to other data in the object/table you select. For example, if you are exploring the Class table, looking for student information, consider if the Class table would have many student records? If Yes, you search in Other Items That Are Linked to the Object/Table. If No, search in Fields.
- Fields in the Object/Table: Browse in
Fields
for items with Many to One relationships with the selected Object/Table, if what you are looking for has only a single instance in the selected Object/Table. For example, if you are looking for information on a class that an individual student is taking in the
Class Student table, you know that there are many student records, but
only a single class in the whole table.
Note: The Fields folder contains sub-folders that indicate a join, which when clicked, allows access to the data in the joined table. Exploring these fields is useful when a field in the first table is numeric, but you want readable text on your report. In the screen shot below, Contact (User), indicates that Contact is the field name in the initial Building table, and User is the name of the table being joined. When you click on one of these sub-folders, you initiate the join. Essentially, you ask the Reporting Tool to join the User table to see more details about your Building's Contact.

- Other Items That Are Linked to the Object/Table: Browse in
Other Items That Are Linked for items with One to Many relationships with the selected Object/Table, in situations where what you are looking for has multiple instances in the selected Object/Table. For example, if you are looking in the
Class table for student information, you know there will be
many student records, so you search in the
Other Items That Are Linked folders.
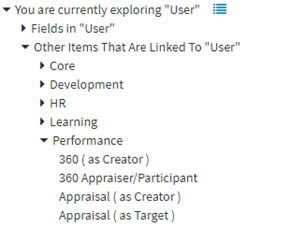
Note: The Other Items That Are Linked to folder contains some items that when clicked will create a relation between the table you are exploring and the secondary table. In this example below, if you click Appraisal (as Creator), the Appraisal table opens in the Your Data pane, with a relation chain between the User table and the Appraisal table.

- Fields in the Object/Table: Browse in
Fields
for items with Many to One relationships with the selected Object/Table, if what you are looking for has only a single instance in the selected Object/Table. For example, if you are looking for information on a class that an individual student is taking in the
Class Student table, you know that there are many student records, but
only a single class in the whole table.
-
When you find a field you want to add to your report, click the field name.
The Field Actions area expands to display the Column Title and a link to add the field to the Cart.
-
In the
Field Actions area, if desired, modify the name of the column, by typing a new name in the
Column Title field. To add the field as a column on the report, click
Add this field to my report.
This adds the field to your Cart at the bottom of the screen, below the Report pane. Columns can be removed from the report by clicking the Remove icon
 .
.
-
If there is at least one column in your Cart, the Cart will contain a
View Your Report button. Click
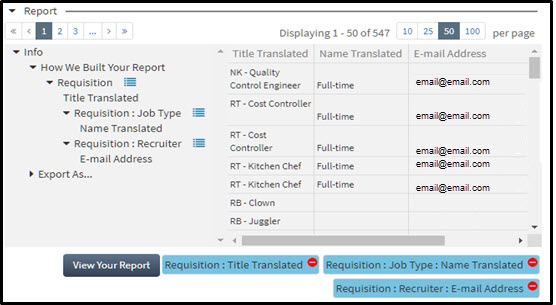
View Your Report to build the report in the Report pane, using the selected columns.
The first column in the Report pane, titled Info, displays all included data as a tree.

- Expand the Info tree to see how the application assembled your report.
- To add additional fields from the same table, navigate the info tree and quickly jump back to that same relation chain.
- Sort columns, if desired, in the Report pane. Sorting is performed via a 3-way clickable toggle; Ascending » Descending » Off. When a column sorting is selected, it moves to the top of the sorting list, overriding other sorting options.
-
When you are satisfied with your report, click
Export As in the Info tree and select one of the export options (Excel, CSV, Adobe Acrobat, HTML, Advanced Report Wizard, or MySQL Query). Selecting
Advanced Report Wizard sends Data Explorer's query to the Report Wizard in a new tab. From there you may save your report with filters, formatted columns, and other Report Wizard features. This is useful for testing.
After you export your report, you can no longer modify it in Data Explorer. If you export to the Advanced Report Wizard, and chose to save it in that tool, then that report will display on the Reports Management screen, along with all other reports you have created.
Parent Topic: Create Reports