Consultant Progress Chart

Use the Consultant Progress chart to view how each consultant's JTD % is trending compared to the remaining work on the project. This information is presented at the WBS level, and updates as you select different levels on the Consultants Planning grid. Use this information to quickly analyze each consultant's progress and form comparisons against other consultants. You can hover over or tap a bar on the chart to see specific amounts.

Contents

As you select different WBS elements on the Consultants planning grid, amounts on the Consultants Progress chart automatically update. The chart also updates to reflect any edits that are made to the plan when the plan is saved.

If your firm uses Vision Multicurrency, the currency amounts display in the project's billing currency or project currency. The currency is based on the Use Billing Currency not Project Currency option in Vision > Accounting > System Settings.

Note: Under certain conditions, the Consultants planning page includes a toggle button that allows you to switch the grid from displaying bill to cost amounts. If set to Cost, the Consultants grid updates to display cost amounts for baseline, planned, JTD, and planned less JTD. The progress chart above the grid updates to display cost amounts for JTD and ETC (Navigator). The chart titles also update to indicate Cost is selected. See the View Consultant Bill or Cost Amounts online help topic for more information.
Field Description
Consultant Name or Type

The consultant names and/or consultant types display on the left side of the chart, with an associated progress bar for each. The consultant name displays when it is associated with a planned amount or JTD charges to direct or reimbursable consultant accounts. The consultant type displays for any consultant account types that do not have associated consultant names. The consultant types are grouped below the consultant names.

Consultant Progress Bars

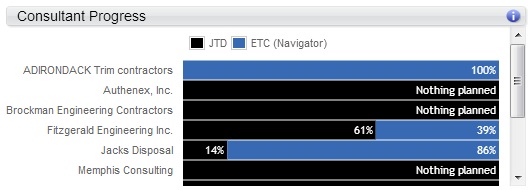
The JTD and ETC (Navigator) bars display what percent of the total planned bill or cost amount is complete through today, and what percent of the planned bill or cost amount remains for each consultant type.

  • JTD: This is the sum of all consultant-related charges on posted transactions and committed purchase orders through today. For consultant names, it is the sum of all charges for the name. When no name is assigned, though, it is the sum of all charges for the account that displays for the consultant type.
  • ETC (Navigator): This is the percent of the plan that remains for completion through today. For consultant names, it is the sum of all charges for the name. When no name is assigned, though, it is the sum of all charges for the account that displays for the consultant type.

ETC (Navigator) % = (ETC (Navigator)/(ETC (Navigator) + JTD)) * 100

You can view a summary of the percentages for each consultant. For example, on the following project, Fitzgerald Engineering Inc. is 61% complete.

You can also hover over each consultant's progress bar to view a summary of the amounts. For example, when you hover over Fitzgerald Engineering Inc., the respective JTD, ETC, EAC, and planned amounts and calculations display.

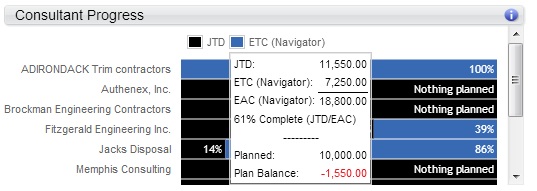
To complete this calculation, the EAC, JTD, and ETC amounts are pulled directly from the Consultants planning grid and then calculated as follows:

JTD = 11,550.00

ETC (Navigator) = 7,250.00

EAC (Navigator) = 18,800.00

% Complete = 61% (JTD/EAC)

ETC % = 39%

Because the JTD is greater than the planned amount, the Plan Balance displays in red to alert you that the project is trending to be over budget.

If there is JTD but no planned amount, the bar displays Nothing planned.

Note: There is a potential discrepancy in the ETC (Navigator) amount versus what displays for the ETC in Vision.