AR Aging Chart
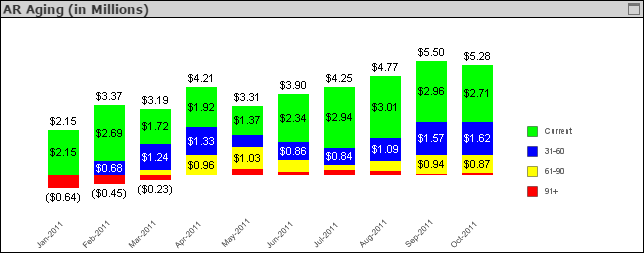
The AR Aging chart displays AR amounts, broken down by aging range, as of the end date of each of the fiscal periods in the current fiscal year. Each full bar represents the total AR at the end of that period, and each segment in a bar represents the AR amount for invoices in that aging range.

The AR aging ranges are Current (0 - 30 days), 31 - 60 days, 61 - 90 days, and over 90 days.
Rounded total AR amounts display above each bar and rounded aging range amounts display in the segments where space allows. For an aging range segment for which no amount displays, position the tip of the mouse pointer over that segment in the bar to display the amount. (Refer to the Trending DSO Detail table on this dashboard to see total AR amounts by period that are exact to the nearest dollar.)
Invoice Age Calculation
As part of Costpoint Analytics configuration, your system administrator specifies whether your firm calculates the age of receivables based on invoice dates or payment due dates.
If your firm ages invoices from the invoice date, CFO Dashboards calculates the age of the AR amount associated with an invoice for the current period as of the current date: Age in days for the AR current period = Current date - Invoice date.
For historical periods, CFO Dashboards calculates the age of each AR amount as of the period end dates: Age in days for a prior period = Period end date - Invoice date. Invoices for which full payment was received in a period are not included in the AR aging data for that period.
If your firm ages invoices from the due date, Costpoint Analytics uses due dates rather than invoice dates in these calculations.
Filter Options
- AR amounts for a specific company (if your firm has multiple companies in Costpoint)
- AR amounts associated with one or more specific organization codes. Use the
 icon at the top of the
Org filter list to display organization codes for all levels of the organization structure or only the organization codes for a specific level.
