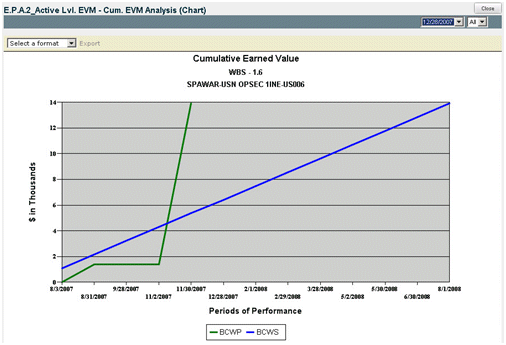
Budgeting & Planning provides analytical charts that graphically show the key EV artifacts of time-phased budgeted and actual cost, along with earned value. Additionally, there are graphical presentations of cost and schedule variance trends over time based upon either dollars or cost percent figures.
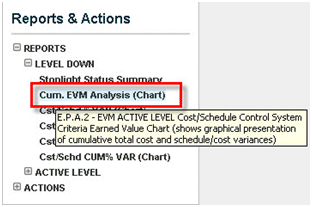
To access this report, from the Reports & Actions menu, click: Reports » Level Down » E.P.A.2 Cum.
EVM Analysis (Chart)

This chart shows Actual Cost of Work Performed in green, Budgeted Cost of Work Performed in blue and Budgeted Cost of Work Scheduled in purple. It provides a quick visual earned value analysis.
