You use the calendar bars to select the analysis period you are interested in.
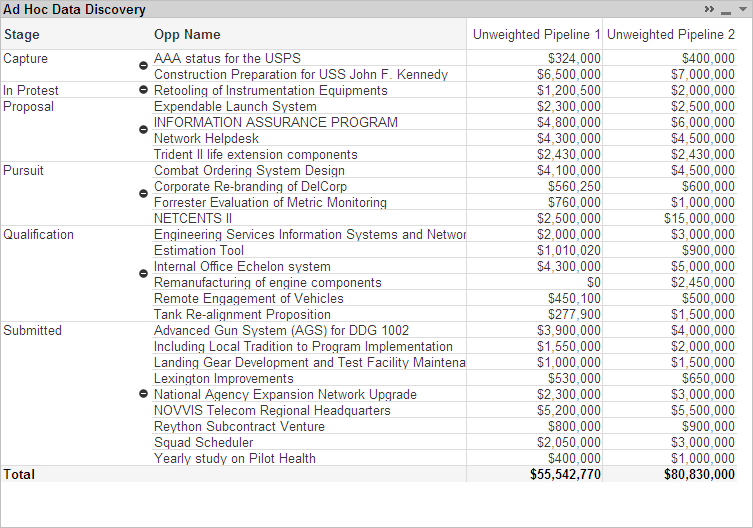
You select the Detail option under Stage Type in the upper-left corner of the tab.
In Dimensions, you select Stage and Opp Name.
In Metrics, you select Unweighted Pipeline 1 and Unweighted Pipeline 2.
You click ![]() on the title bar of the Ad Hoc Data Discovery table to display it in the pivot table format.
on the title bar of the Ad Hoc Data Discovery table to display it in the pivot table format.
